Examples: Tests
This section assumes that Test Agents (as many as are required for the tests) have been created according to Creating and Deploying a New Test Agent.
Overview of Test Orchestration
Before you can create and run a test through the REST API, you must have a template on which to base the test defined in Control Center, as explained in the chapter Test and Monitor Templates. All parameters specified in that template as "Template input" then need to be assigned values when you create a test from it in the REST API.
Creating and Running a Test
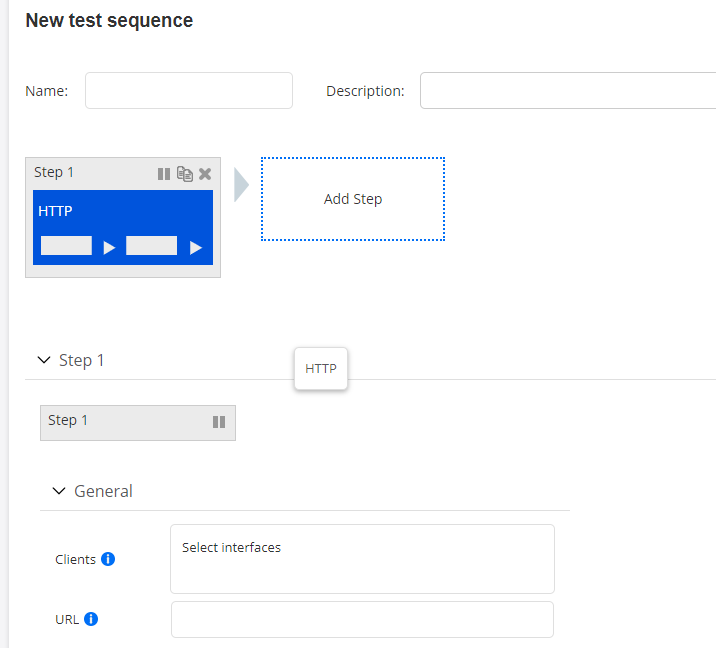
The template we will use for our test in this example is an HTTP test template.

To inspect that template through the REST API, we retrieve a list of all test templates in the account:
# Request settings
# NOTE: User is able to pass additional parameters as a query string ?limit=100&offset=111:
# limit: Changes number of elements returned from API
# offset: Changes element from which results will be returned
url = '%s/accounts/%s/test_templates/%s' % (args.ncc_url, args.account, args.query_params)

# Get list of test templates
response = requests.get(url=url, headers={'API-Token': args.token})
If our HTTP template is the only test template defined, the response will look like this:
{
  "count": 1,
  "items": [
    {
      "inputs": {
        "clients": {
          "input_type": "interface_list"
        },
        "url": {
          "input_type": "string"
        }
      },
      "description": "This is a template for HTTP tests",
      "name": "HTTP_test",
      "id": 1
    }
  ],
  "next": null,
  "limit": 10,
  "offset": 0,
  "previous": null
}
The HTTP test in this template has two mandatory inputs left to be
defined at runtime: clients (list of Test Agent interfaces playing
the role of clients) and url (the URL to fetch using HTTP). The
parameter names are those defined as Variable name in Control Center.
Here, they are simply lowercase versions of the Control Center display names
("clients" vs. "Clients", etc.).
If there are multiple templates, and you want to inspect just a single template with a known ID, you can do that as follows:
# Request settings
url = '%s/accounts/%s/test_templates/%s/' % (args.ncc_url, args.account, args.monitor_id)

# Get test template
response = requests.get(url=url, headers={'API-Token': args.token})
We now create and run the HTTP test using the POST operation for tests.
Below is code supplying the required parameter settings for a test based on the HTTP test template. Depending on the structure of the template, the details here will of course vary. Another example with a slightly more complex test template is found in the section Example with a Different Test Template.
# Request settings
url = '%s/accounts/%s/tests/' % (args.ncc_url, args.account)

# Parameter settings for test
json_data = json.dumps({
    "name": "REST API initiated HTTP test",
    "description": "This is an HTTP test initiated from the REST API",
    "input_values": {
        "clients": {
            "input_type": "interface_list",
            "value": [{
                "test_agent_id": 1,
                "interface": "eth0",
                "ip_version": 4
            }]
        },
        "url": {
            "input_type": "string",
            "value": "example.com"
        },
    "status": "scheduled",
    "template_id": 1
})

# Create and start test
response = requests.post(url=url, data=json_data, headers={
    'API-Token': TOKEN,
    'Accept': 'application/json; indent=4',
    'Content-Type': 'application/json',
})
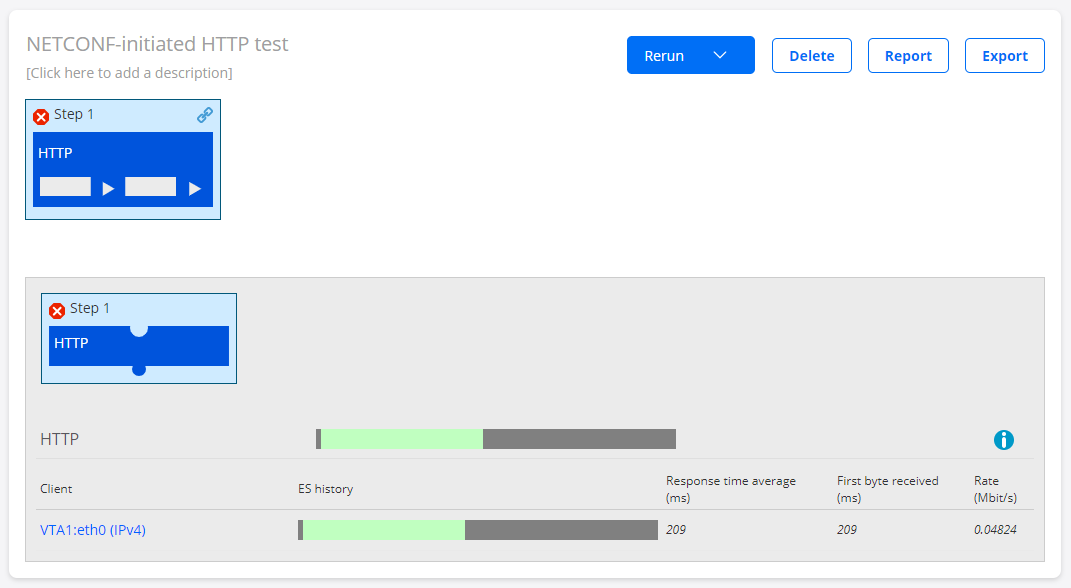
The execution of the test is displayed in Control Center:

Control Center will also respond to the REST API command with the ID of the test. In this example, the test ID is 47:
Status code: 201
{
  "template_id": 1,
  "description": "",
  "name": "HTTP_test",
  "id": 47
}
The test ID can also be found in the URL for the test in the Control Center web GUI.
In this example, that URL is https://<host
IP>/<account>/testing/47/.
Example with a Different Test Template
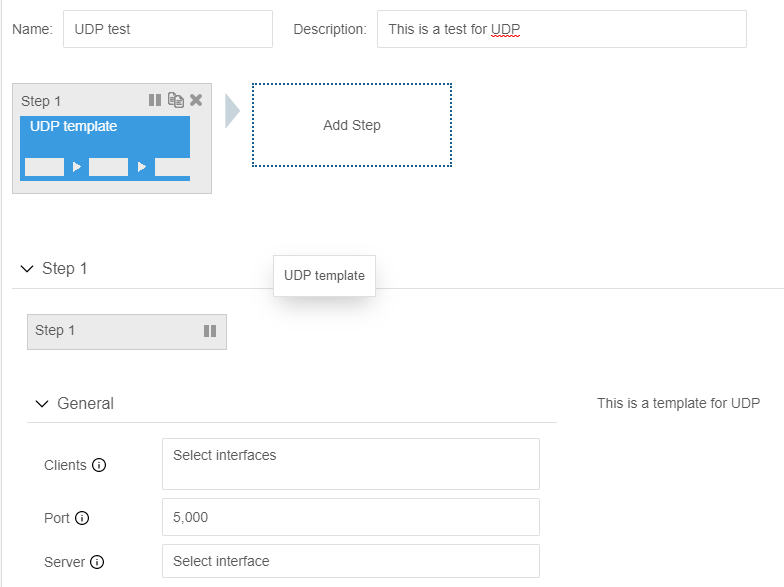
Here is another example of a test template: one for UDP, taking as input a server, a list of clients, and a UDP port number. In the Paragon Active Assurance GUI, this UDP template looks as follows:

To supply the inputs to this template, we can use the code below. Here, we have
overridden the default value of port. If the default value (5000)
is kept, the port section can be omitted from
input_values.
# Request settings
url = '%s/accounts/%s/tests/' % (args.ncc_url, args.account)

# Parameter settings for test
json_data = json.dumps({
    "name": "REST API initiated UDP test",
    "description": "This is a UDP test initiated from the REST API",
    "input_values": {
        "clients": {
            "input_type": "interface_list",
            "value": [{
                "test_agent_id": 1,
                "interface": "eth0",
                "ip_version": 4
            }]
        },
        "server": {
            "input_type": "interface",
            "value": {
                "test_agent_id": 2,
                "interface": "eth0",
                "ip_version": 4
            }
        },
        "port": {
            "input_type": "integer",
            "value": "5050"
        }
    },
    "status": "scheduled",
    "template_id": 2
})

# Create and start test
response = requests.post(url=url, data=json_data, headers={
    'API-Token': TOKEN,
    'Accept': 'application/json; indent=4',
    'Content-Type': 'application/json',
})

print 'Status code: %s' % response.status_code
print json.dumps(response.json(), indent=4)
Retrieving Test Results
You retrieve results for a test by pointing to the test ID. This also fetches the full configuration of the test.
The basic test results consist of a passed/failed outcome for each test step and for the test as a whole.
By default, for tests where this is relevant, the test results also include averaged
metrics taken over the full duration of the test. The average metrics are found in
tasks > streams >
metrics_avg. You can turn these average metrics off by setting
with_metrics_avg to false in the query string.
Optionally, this operation can return detailed (second-by-second) data metrics for
each task performed by the test (again, for tests which produce such data). You turn
on this feature by setting with_detailed_metrics to true. By
default, this flag is set to false. The detailed data metrics are found under
tasks > streams >
metrics.
There is yet another setting with_other_results which, if set to
true, causes additional test results to be returned for the Path trace task type
(routes and reroute events).
Example 1: TWAMP Test
A TWAMP test is an example of a test that produces metrics continuously.
Below is Python code for getting the results from a TWAMP test:
# Request settings
url = '%s/accounts/%s/tests/%s/' % (args.ncc_url, args.account, args.test_id)

# Get test
response = requests.get(url=url, headers={'API-Token': args.token})
The output will look something like this:
{
  "description": "",
  "end_time": "2017-09-03T20:05:04.000000Z",
  "gui_url": "https://<Control Center host and port>/demo/testing/48/",
  "name": "TWAMP_test",
  "report_url": "https://<Control Center host and port>/demo/testing/48/report_builder/",
  "start_time": "2017-09-03T20:04:27.000000Z",
  "status": "passed",
  "steps": [
    {
      "description": "",
      "end_time": "2017-09-03T20:05:03.000000Z",
      "id": 48,
      "name": "Test from template",
      "start_time": "2017-09-03T20:04:27.000000Z",
      "status": "passed",
      "status_message": "",
      "tasks": [
        {
          "name": "",
          "streams": [
            {
              "gui_url": "https://10.0.157.46/dev/results/72/rrd_graph/?start=1526898065&end=1526898965",
              "id": 72,
              "is_owner": true,
              "metrics": [
                [
                  "2017-09-03T20:04:27",
                  "2017-09-03T20:04:27",
                  4.4356,
                  1.7191,
                  9.9563,
                  23.5623,
                  21.8432,
                  391,
                  21.09,
                  93,
                  66,
                  null,
                  null,
                  null,
                  null,
                  48.07,
                  212,
                  189,
                  null,
                  null,
                  null,
                  null,
                  100,
                  100,
                  null,
                  null,
                  0,
                  null,
                  null
                ],
                [
                  "2017-09-03T20:04:27",
                  "2017-09-03T20:04:28",
                  <metrics omitted>
                ],
                <remaining metrics omitted>
              ],
              "metrics_avg": {
                "davg": 10.167887,
                "davg_far": null,
                "davg_near": null,
                "dmax": 24.934801,
                "dmax_far": null,
                "dmax_near": null,
                "dmin": 1.143761,
                "dmin_far": null,
                "dmin_near": null,
                "dv": 23.791039,
                "dv_far": null,
                "dv_near": null,
                "end_time": "2018-05-21T02:01:40",
                "es": 1,
                "es_delay": null,
                "es_dscp": 0,
                "es_dv": null,
                "es_loss": 1,
                "es_ses": null,
                "loss_far": 18.584512,
                "loss_near": 51.791573,
                "lost_far": 81.910714,
                "lost_near": 228.285714,
                "miso_far": 60.5,
                "miso_near": 206.267857,
                "rate": 4.507413,
                "recv": 397.339286,
                "sla": 0,
                "sla_status": "unknown",
                "start_time": "2018-05-21T02:00:40",
                "uas": null
              },
              "metrics_headers": [
                "start_time",
                "end_time",
                "rate",
                "dmin",
                "davg",
                "dmax",
                "dv",
                "recv",
                "loss_far",
                "lost_far",
                "miso_far",
                "dmin_far",
                "davg_far",
                "dmax_far",
                "dv_far",
                "loss_near",
                "lost_near",
                "miso_near",
                "dmin_near",
                "davg_near",
                "dmax_near",
                "dv_near",
                "es",
                "es_loss",
                "es_delay",
                "es_dv",
                "es_dscp",
                "es_ses",
                "uas"
              ],
              "metrics_headers_display": [
                "Start time",
                "End time",
                "Rate (Mbit/s)",
                "Min round-trip delay (ms)",
                "Average round-trip delay (ms)",
                "Max round-trip delay (ms)",
                "Average round-trip DV (ms)",
                "Received packets",
                "Far-end loss (%)",
                "Far-end lost packets",
                "Far-end misorders",
                "Min far-end delay (ms)",
                "Average far-end delay (ms)",
                "Max far-end delay (ms)",
                "Far-end DV (ms)",
                "Near-end loss (%)",
                "Near-end lost packets",
                "Near-end misorders",
                "Min near-end delay (ms)",
                "Average near-end delay (ms)",
                "Max near-end delay (ms)",
                "Near-end DV (ms)",
                "ES (%)",
                "ES loss (%)",
                "ES delay (%)",
                "ES DV (%)",
                "ES DSCP (%)",
                "SES (%)",
                "Unavailable seconds (%)"
              ],
              "reflector": 18,
              "sender": {
                "ip_version": 4,
                "name": "eth1",
                "preferred_ip": null,
                "test_agent": 1,
                "test_agent_name": "VTA1"
              }
            }
          ],
          "task_type": "twamp",
        }
      ]
    }
  ]
}
Example 2: DSCP Remapping Test
A DSCP remapping test is one that does not produce continuous metrics, but rather a single set of results at the end. It cannot run concurrently with anything else. The format of the output for this test is indicated below. (The Python code for retrieving the test results is the same except for the test ID.)
{
  "description": "",
  "end_time": "2019-01-04T07:19:53.000000Z",
  "gui_url": "https://10.0.157.46/dev/testing/154/",
  "id": 154,
  "name": "DSCP",
  "report_url": "https://10.0.157.46/dev/testing/154/report_builder/",
  "start_time": "2019-01-04T07:19:49.000000Z",
  "status": "passed",
  "steps": [
    {
      "description": "",
      "end_time": "2019-01-04T07:19:52.000000Z",
      "id": 154,
      "name": "Step 1",
      "start_time": "2019-01-04T07:19:49.000000Z",
      "status": "passed",
      "status_message": "",
      "step_type": "exclusive_task_container",
      "tasks": [
        {
          "end_time": "2019-01-04T07:19:52",
          "log": [
            {
              "level": "debug",
              "message": "Starting script",
              "time": "2019-01-04T07:19:49"
            },
            {
              "level": "debug",
              "message": "Sending from VTA1:eth1 (IPv4) to VTA2:eth1 (IPv4)",
              "time": "2019-01-04T07:19:49"
            },
            {
              "level": "debug",
              "message": "Sending packets",
              "time": "2019-01-04T07:19:50"
            },
            {
              "level": "info",
              "message": "Passed: ",
              "time": "2019-01-04T07:19:52"
            }
          ],
          "name": "Step 1",
          "results": {
            "create": [
              {
                "id": 269,
                "type": "Table"
              }
            ],
            "update": {
              "269": {
                "columns": [
                  {
                    "name": "Sent DSCP",
                    "type": "string"
                  },
                  {
                    "name": "Received DSCP",
                    "type": "string"
                  },
                  {
                    "name": "Test result",
                    "type": "string"
                  }
                ],
                "rows": [
                  [
                    "cs0 (0)",
                    "cs0 (0)",
                    "Passed"
                  ],
                  [
                    "cs1 (8)",
                    "cs1 (8)",
                    "Passed"
                  ],
                  [
                    "af11 (10)",
                    "af11 (10)",
                    "Passed"
                  ],
                  <... (DSCPs omitted)>
                  [
                     "cs7 (56)",
                     "cs7 (56)",
                     "Passed"
                   ]
                 ],
                 "title": "DSCP remapping results"
               }
             }
           },
           "start_time": "2019-01-04T07:19:49",
           "status": "passed",
           "status_message": "",
           "task_type": "dscp_remapping"
         }
       ]
     }
   ]
 }
Generating a PDF Report on a Test
You can generate a PDF report on a test directly from the REST API. The report has the same format as that generated from the Control Center GUI.
By default, the report covers the last 15 minutes of the test. You can specify a
different time interval by including the start and end
parameters in a query string at
the end of the URL. The time is given in UTC (ISO 8601) as specified in IETF
RFC 3339.
In addition, the following options can be included in the query string:
worst_num: For each task in a test, you can specify how many measurement results to show, ranked by the number of errored seconds with the worst on top. The scope of a measurement result is task-dependent; to give one example, for HTTP it is the result obtained for one client. The default number is 30.graphs: Include graphs in the report.
Example:
# Include graphs
graphs = 'true'

# Request settings
url = '%s/accounts/%s/tests/%s/pdf_report?graphs=%s' % (args.ncc_url, args.account, args.test_id, graphs)

# Get test
response = requests.get(url=url, headers={'API-Token': args.token})

print 'Status code: %s' % response.status_code
print json.dumps(response.json(), indent=4)