Custom Log Ingestion
Custom log ingestion was introduced in Juniper Advanced Threat Prevention software release version 5.0.4.
About Custom Log Ingestion
Custom Log Ingestion Overview
The custom log ingestion feature lets you create your own log parsers on the ATP Appliance appliance using sample logs you provide. This way, if you want to use logs from a vendor not supported by existing ATP Appliance log parsers, you can do so. By mapping fields in your sample logs to ATP Appliance event fields, you build your own custom parser, indicating which types of events will generate an incident. You can also view statistics on incoming logs and delete collected logs.
Configure the Log Parser
Use the following procedure to create your own custom log parser.
- Navigate to the ATP Appliance Central Manager Web UI Config>Environmental Settings>Custom External Event Collectors configuration page and click Create.
- In the Create New Source page, enter the following information:
Name—Create a unique, descriptive name for the log.
Description—Enter a description of the log file. (This field is optional.)
Type—Select the type of log from the following choices: Firewall, Web Gateway, Endpoint AV, Endpoint Response, or IPS.
Once the required fields are complete, click Next.
Figure 1: Configure Custom Log Source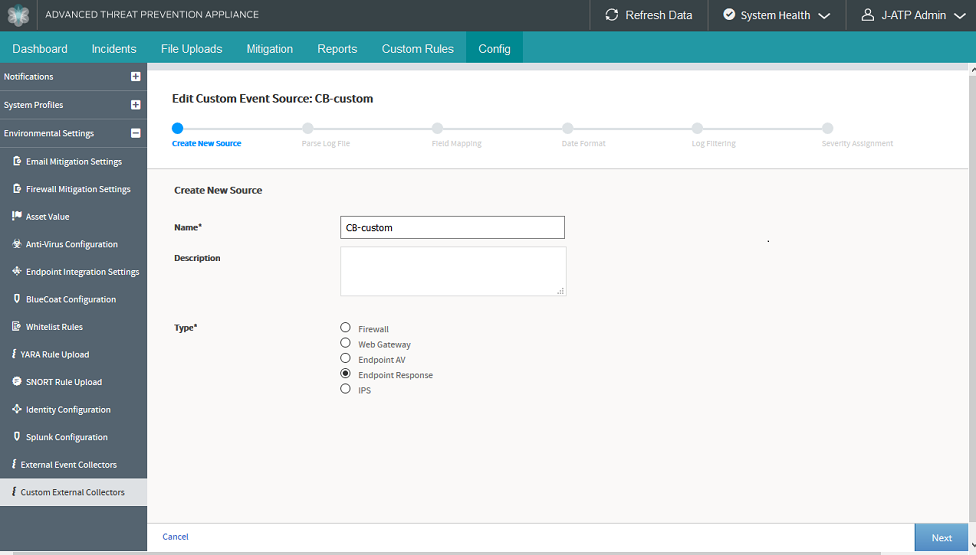
- In the Parse Log File page, do the following:
Upload the raw log file by browsing to it or paste it into the field provided below the Browse button.
Note:The log file must contain an RFC-compliant syslog header.
From the choices provided, tell ATP Appliance what format the log file is. You can select XML, JSON, CSV, or Other.
Figure 2: Provide Custom Log File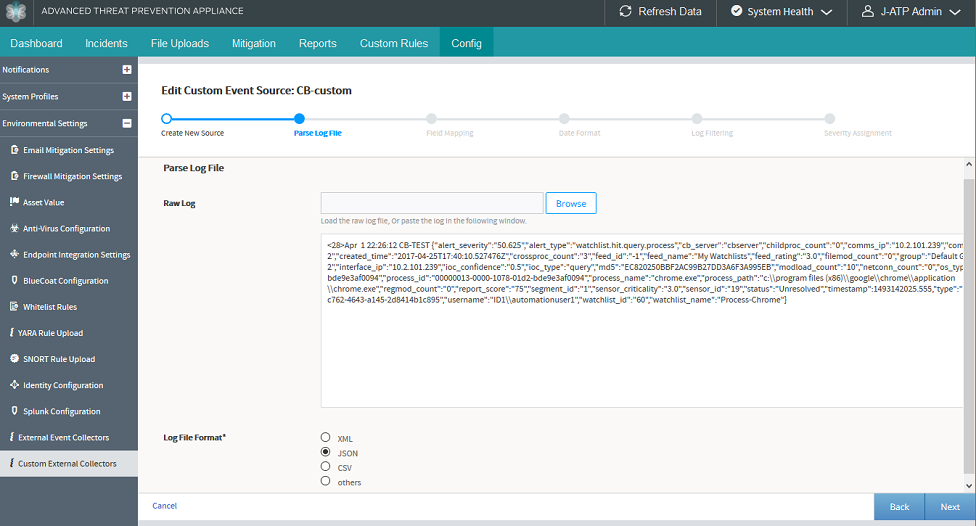
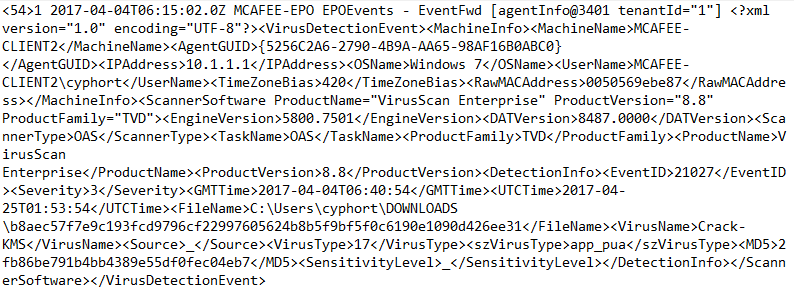
XML Log
Here is an example XML Log:
JSON Log
Here is an example JSON log:

CSV format
If your log file is in CSV format, you may provide a comma delimited list of field names in the CSV Headers field. If the CSV headers are not provided, the fields will be named as csv[N] where N is the field position.
For CSV format, here is an example PAN log:

Other - Grok Pattern
If you select Other, you must supply a grok pattern for the log file. A grok pattern may consist of one or more lines. The grok pattern line beginning with "LOGPATTERN" is the pattern which will be applied to the logs. A grok pattern must include a pattern named LOGPATTERN, otherwise the parser will not have any pattern to use. For example:
NOTCOMMA (?:[^,]*)
LOGPATTERN %{NOTCOMMA:type},IP Address: %{IP:endpoint_ip},Computer name: %{NOTCOMMA:endpoint_hostname},Source: %{NOTCOMMA:action},Risk name: %{NOTCOMMA:threat_name},%{NOTCOMMA:occurence_cnt},%{NOTCOMMA:file_path},%{NOTCOMMA:unknown_field_1},Actual action: %{NOTCOMMA:actual_action},Requested action: %{NOTCOMMA:requested_action},Secondary action: %{NOTCOMMA:secondary_action},Event time: %{NOTCOMMA:event_start_time},Inserted: %{NOTCOMMA},End: %{NOTCOMMA},Last update time: %{NOTCOMMA},Domain: %{NOTCOMMA},Group: %{NOTCOMMA},Server: %{NOTCOMMA},User: %{NOTCOMMA:endpoint_username},Source computer: %{NOTCOMMA:source_hostname},Source IP: %{NOTCOMMA:source_ip},Disposition: %{NOTCOMMA:disposition},Download site: %{NOTCOMMA},Web domain: %{NOTCOMMA},Downloaded by: %{NOTCOMMA},Prevalence: %{NOTCOMMA},Confidence: %{NOTCOMMA},URL Tracking Status: %{NOTCOMMA},%{NOTCOMMA},First Seen: %{NOTCOMMA},Sensitivity: %{NOTCOMMA},%{NOTCOMMA},Application hash: %{NOTCOMMA:file_hash},Hash type: %{NOTCOMMA},Company name: %{NOTCOMMA},Application name: %{NOTCOMMA:file_name},Application version: %{NOTCOMMA},Application type: %{NOTCOMMA},File size \(bytes\): %{NOTCOMMA},Category set: %{NOTCOMMA},Category type: %{NOTCOMMA}
For Grok pattern, here is an example Symantec EP log:
<28>Apr 7 09:44:02 ATA-SYMANTEC-MANAGER SymantecServer: Virus found,IP Address: 10.2.101.87,Computer name: ATA-SYMANTEC,Source: Real Time Scan,Risk name: Trojan.Gen.2,Occurrences: 1,C:\Users\cyphort\Documents\CI_TMP1aENwP,'',Actual action: Quarantined,Requested action: Cleaned,Secondary action: Quarantined,Event time: 2017-04-07 17:00:04,Inserted: 2017-04-07 09:44:02,End: 2017-04-07 17:00:04,Last update time: 2017-04-07 09:44:02,Domain: Default,Group: My Company,Server: ATA-SYMANTEC-MANAGER,User: cyphort,Source computer: ,Source IP: ,Disposition: Reputation was not used in this detection.,Download site: ,Web domain: ,Downloaded by: ,Prevalence: Reputation was not used in this detection.,Confidence: Reputation was not used in this detection.,URL Tracking Status: Off,,First Seen: Reputation was not used in this detection.,Sensitivity: ,MDS,Application hash: 0C20F6A78CCF3835B4EBFA5F4E7D476D6529DE531FE381AA2546A798448C41F8,Hash type: SHA2,Company name: ,Application name: CI_TMP1aENwP,Application version: ,Application type: 127,File size (bytes): 15936,Category set: Malware,Category type: Virus
When you click Next, ATP Appliance will parse and validate the provided log file data.
-
In the Field Mapping page, on the left side, you select one or more
check boxes beside a field that has been parsed from your log file. On
the right side, you select a pre-defined description of the field from
the provided options. For example, you might map a field on the left
side called “interface_ip” to a ATP Appliance field on the right side
called “Endpoint IP”.
Once your check boxes are selected, click the Map button to link the fields. The mapped fields now appear in another section of the page which lists all fields that have been mapped to each other.
Note:Note the following details about the Field Mapping page:
-
Use the circular arrow in the Mapped Fields section to undo a mapping.
-
Click the filter icon in the Unmapped Fields section to enter text for searching.
-
You can select multiple fields from the left side and map them to one field from the right side. When you do this, a “Sort” icon appears. Use the Sort capability to select the order in which multiple fields will be applied based on whether those fields contain a valid value or not.
-
Select the “Counter” check box to count the number of times a field appears. You can then view the results of this counter in the External Event Collector page, which you will configure once your parser is complete.
When selecting which fields to count, it is advised that you do not select items such as IP address, as those may be ubiquitous in the log file and not scalable.
Click Next once all fields are mapped.
Figure 3: Map Log File Fields
-
-
You do not have to enter any text in the Date and Time page if your log
file is using a standard time as dictated by RFC 3164 or RFC 5424. Those
headers are automatically parsed. If the timestamp cannot be parsed, use
the Ruby strftime to provide a format string so that ATP Appliance can
interpret the date and time in your log file as the event start
time.
More about date and time format:
-
Information on Ruby strftime format can be found here: https://ruby-doc.org/core-2.3.0/Time.html#method-i-strftime
-
Examples of supported date and time formats are as follows:
ISO 8601:
2018-10-29T16:36:02+00:00
2018-10-29T16:36:02Z
20181029T163602Z
2018-10-29T10:48:37-07:00
RFC 2822:
Mon, 29 Oct 2018 17:48:37 +0000
Mon, 29 Oct 2018 10:48:37 -0700
RFC 3339:
1985-04-12T23:20:50.52Z
1996-12-19T16:39:57-08:00
RFC 3164 syslog header:
Apr 9 22:26:12
RFC 5424 syslog header:
2018-04-04T15:31:33+09:00
2017-04-04T06:15:02.0Z
-
-
In the Log Filtering page, you can create filters to tell ATP Appliance
which events are malicious and which are not as you decide what logs are
to be kept and which ones can be ignored. This removes logs that are
“noisy” and not of particular interest and keep logs that are related to
malicious events.
With these filters, you can select “exact match” filters or “contains” for the string you enter.
Click the Add button and configure filtering conditions as follows:
-
Select a log file field from the pulldown list.
-
Select Matches or Contains. If you select Matches, your provided string must match the selected field exactly. If you select Contains, your provided string must appear as a substring within the selected field.
-
In the edit field, enter a string for filtering log files and click Add.
Click OK and your condition is added to the filter. You can add multiple filters. An “or” condition is applied to the list of filters, therefore the order of filters does not matter.
Note:Select the check box and click the Delete button to remove a filter.
Figure 4: Create Log Filter
-
- In the Severity Assignment page, you assign a severity
level to an event based on filtering parameters you configure.
Click the Add button and set conditions as follows:
Select a Severity level. The options are: Benign, Low, Medium, High, and Critical.
Select a field from the pulldown list to set the severity level for that field.
Select Matches or Contains. If you select Matches, your provided string must match the selected field exactly. If you select Contains, your provided string must appear as a substring within the selected field.
In the edit field, enter a string for filtering log files and click Add.
For example, when you are finished, you may have set the following: field “threat_name” contains “Adware” = Low severity, but set “threat_name” contains “Virus” = High severity.
Click OK and your severity level setting is added.
Note:You can drag and drop severity level settings in the list view on the main page to change the order. With Severity Assignment, the order does matter. The first match is the one that assigns severity.
Figure 5: Configure Event Severity Figure 6: Severity Assignment Main Page
- Click Finish and you are presented with the results of your custom parser as they are applied to the sample logs provided. Please review this carefully to determine whether your mapping, filtering, and severity assignment are as expected.
When you are finished configuring your custom log parser, the filters you created are combined to save only the logs you indicated with a threat level setting based on the criteria you configured.
Use the Log Parser
After you configure the custom log parser, you must apply it to the ATP Appliance Event Collector.
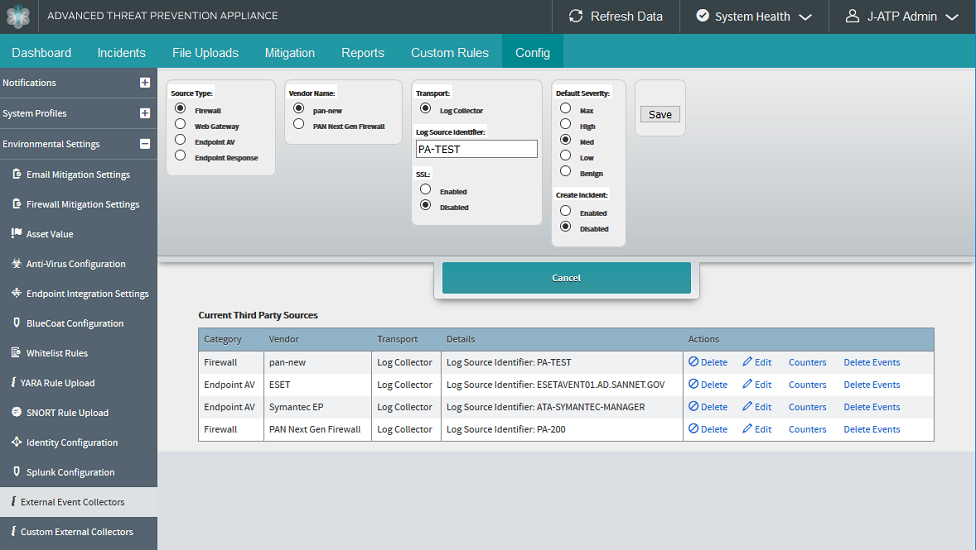
- Navigate to the ATP Appliance Central Manager Web UI Config>Environmental Settings>External Event Collectors configuration page and click Add Third Party Source.
- Select the Source Type. You must select the same type you chose when you configured the custom log parser: Firewall, Web Gateway, Endpoint AV, or Endpoint Response.
- In the Vendor Type field, you should see the name of the custom log parser you created. Select it.
- Select Log Collector and enter the host name of the machine the custom log originates from.
- Configure the rest of the parameters here, including Default Severity. If the custom log parser does not match any severity you set, the default severity here will be used instead.
- Under Create Incident, you can choose whether the events, which pass through the custom parser filtering, will create incidents. Regardless of this setting, events will appear in the Events Timeline and will provide context for malicious events occurring on the same endpoint at approximately the same time. If the Enabled field is selected, these events will also create incidents which appear in the Incidents tab.
- Click Add when you are finished.Figure 7: Add External Event Collector
Custom Log Statistics
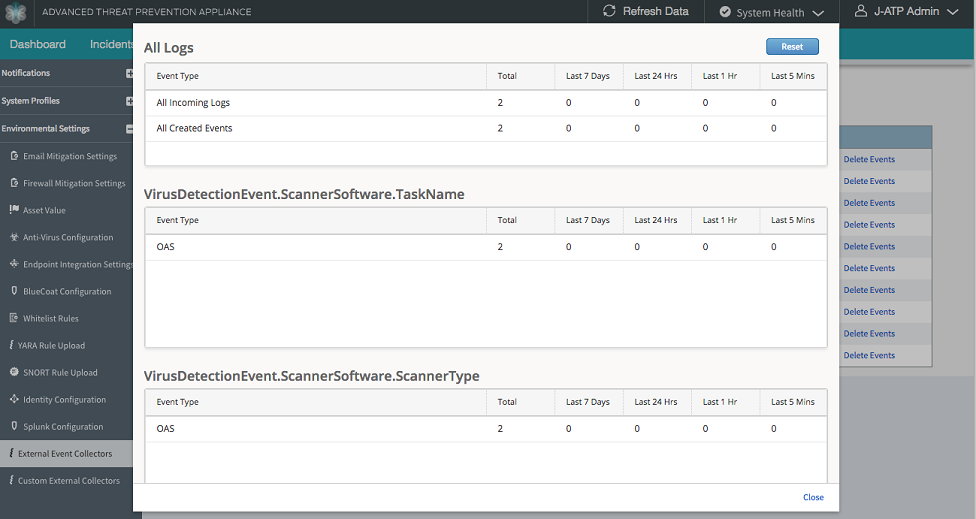
When an External Event Collector is created for a custom log, counters are displayed in the External Event Collector page for that log source. The information displayed in the counter is the number of logs collected over 5 minutes, 1 hour, 1 day, 1 week intervals, and a total count, broken down by the fields you chose when creating the custom log parser.
Logs statistic may include the following:
All Incoming Logs: Aggregate (lifetime), Last 5 minutes, Last 1 hour, Last 24 hours, and Last 7 days
All Created Events: Aggregate(lifetime), Last 5 minutes, Last 1 hour, Last 24 hours, and Last 7 days
Parsed field counts (user selected for counting): From incoming logs, each value that appears is displayed, along with the number of times it has occurred in aggregate (lifetime) - last week, last day, last hour, and last 5 minutes.
From the External Event Collector page, click the Counters link to view log statistics.
