Mitigation and Reporting
Network Mitigation Options
Use the Mitigation tab to block specific threats on integrated security devices in the enterprise network. Additionally, use this Mitigation page to view a list of threats you previously allowlisted via the Incidents page mitigation options.
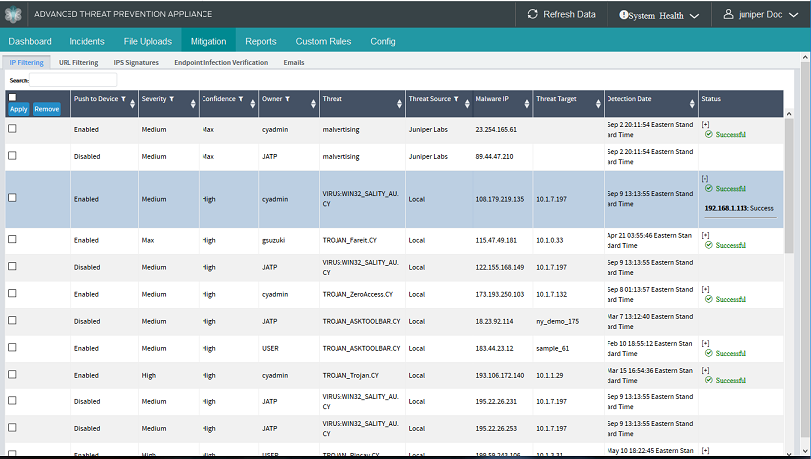
The Juniper ATP Appliance Central Manager Web UI Mitigation Tab provides five different mitigation option views:
Use the Search option on each page to search incident and threat criteria.
Review each blocking strategy in the following sections.
- Blocking Threats at Firewalls
- Blocking Threats at Secure Web Gateways
- Blocking Threats at the IPS/NextGen Firewall
- Verifying Threats on the Endpoint
- Using Allowlist
Blocking Threats at Firewalls
Click the Firewalls button on the Mitigation page to view a list of detected threats that Juniper ATP Appliance recommends you block on enterprise firewall(s).
Click the left-most checkbox(es) to select one or multiple threats for blocking at the Firewall(s), then click the Apply button.
[Alternatively, click the Remove button to remove the selected threat row from the Mitigation list.]
Note:If a mitigation rule is removed and its removal fails, it moves into a failed-remove state. You must repair the issue that caused the remove to fail and then click Remove again to finalize the removal. Some errors that might require a fix before the rule can be removed include (1) Juniper ATP Appliance not being able to obtain the config lock because there were uncommitted changes on the SRX, or perhaps (2) invalid credentials. Be aware, however, that when Juniper ATP Appliance attempts to remove a rule and the removal fails, a detail error message is displayed in the in the Web UI. It is not possible to have a failed-remove state but then try to re-Apply the mitigation rule; do repair the condition causing the removal failure please.
The threats to be blocked (potentially) are detailed as follows:
Malware IP - The IP Address associated with the threat to be blocked
Threat Target- Name of the targeted host.
Threat - Name of the incident by malware name.
Detection Date - Date and time of the malware detection.
Auto-Mitigation - Indicator of pre-configured auto-mitigation
Use the Search field to quickly locate a specific threat.
Caveat: Allowlist rules rely on normal service shutdown to be backed up. Powering off a VM directly will lose the allowlist state because allowlist rules cannot be saved.
The mitigation IP address of a CNC server is not be available for Inside proxy deployments. When a Juniper ATP Appliance is deployed behind a proxy, the Mitigation-> Firewall page in the Juniper ATP Appliance Central Manager Web UI (which typically displays the CNC server IP address to mitigate) will be empty. The destination IP address of any callback is made to the proxy server ip address, so it is not relevant to display the proxy server IP address on the Mitigation->Firewall page.
Refer to the Juniper ATP Appliance CLI Command Reference for more information about setting data path proxies from collector mode, or management network proxy IP addresses from server mode.
Blocking Threats at Secure Web Gateways
Click the Secure Web Gateway button on the Mitigation page to view a list of detected threats identified for blocking on an enterprise secure web gateway(s).
View thew malicious URLs identified for blocking at the SWG(s).
The threats to be blocked (potentially) are categorized as follows:
Domain/URL - The domain or URL associated with the threat to be blocked
Threat - Name of the detected threat
Threat Target - IP address of the targeted host.
Detection Date - Date and time of the Juniper ATP Appliance threat detection.
Use the Search field to quickly locate a specific threat.
Blocking Threats at the IPS/NextGen Firewall
Click the IPS/Next Gen Firewalls button on the Mitigation page to view a list of detected threats that Juniper ATP Appliance recommends you block on enterprise IPS/NextGen Firewall(s).
Click the left-most checkbox(es) to select one (or click Select All) to download signature files for API file submission or other forensics.
The threats to be blocked (potentially) are categorized as follows:
Threat - Name of the detected threat
Detection Date - Date of the Juniper ATP Appliance threat detection
Detection Location - Collector or Core Engine Detection Device
Use the Search field to quickly locate a specific threat.
Verifying Threats on the Endpoint
The Endpoint display lists infections to be verified by downloading the IVP tool and directly validating infections at your enterprise endpoint(s). In addition, at the bottom of the page, a second table lists Endpoint Infection results status information.
Click the Endpoints button on the Mitigation page to view a list of detected threats that Juniper ATP Appliance recommends you verify as active infections on enterprise endpoint(s).
Click the Download IVP link in the Action column to begin the IVP verification process.
The Infections to be Verified table columns are defined as follows:
Severity - The severity of the threat to be verified
Target - The IP Address of the enterprise host associated with the malware download (DL)
Threat - Name of the detected threat
Exposure Date - Date of the Juniper ATP Appliance threat detection at the endpoint
Action - The Download IVP link that generates and downloads a custom IVP package for the selected threat.
Use the Search field to quickly locate a specific threat.
IVP is customized for each malware incident and packaged for delivery to endpoints where it is run specifically to verify whether an infection took place at the endpoint(s) as a result of the currently selected malware download (DL) detected by the Juniper ATP Appliance analysis engines as listed in the Incidents table.
Use a thumb drive to install the package at the enterprise endpoints and then run the custom IVP verification test. The IVP package for a given malware event is not re-usable for a different malware download event; the IVP package is created in real time specifically for each detected malware event.
This IVP process will be automated in an upcoming release. In an upcoming Juniper ATP Appliance release, an alternate delivery option will push the IVP verification package to all enterprise endpoints from the Juniper ATP Appliance Central Manager using a configured domain controller group policy.
Run the IVP script and IVP installer on a targeted (or all) endpoints in the network to determine if the download caused an actual infection.
Using Allowlist
Use the Add to Whitelist option to perform ad hoc incident allowlisting.
Click Add to Whitelist button from the Incidents page sub-tab displays to allowlist a detected Download or Data Theft threat.
Figure 2: Add to Whitelist Option Note:
Note:After allowlisting a DL, all instances of it are removed from the Incidents tab
After selecting Add to Whitelist, update the existing allowlist rules as necessary, as shown in the following figure.
Mitigation Options from the Incidents Tab
Mitigation options are also available from the Central Manager Incidents page.
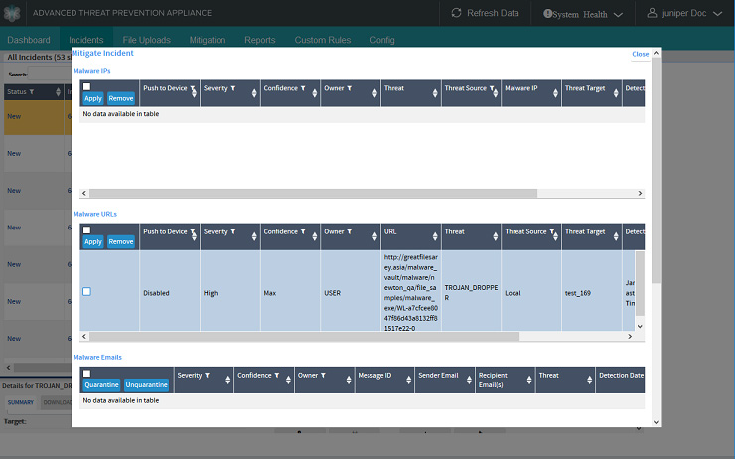
The Details Summary area below the Incidents table displays a Mitigate Incident link.
Click the Mitigate Incident link to open the Mitigate Incident window for Malware IPs and Malware URLs.
Click to checkmark a threat row, and click Apply to submit the threat for blocking.
Updating Allowlist Filtering Rules
Configure Allowlist filtering rules from the Configuration>Whitelist Rules page. Additionally, you can re-configure and refine rule settings while administering allowlists from the Incidents page by using the Add to Whitelist link.
Update configured Allowlist Rules whenever an Incident includes the option to Add to Whitelist, as shown below, the filtering rules criteria can be edited and applied as part of the incident allowlisting process.
To edit Allowlist Filter criteria while adding the incident to the allowlist, click the Add to Whitelist link.
In the Update Whitelist Rule window, you may add additional allowlist rule criteria, deselect (uncheck) currently established criteria, or update the rule set as is.
Click Submit and the incident is added to the allowlist according to the criteria defined and checked in the Update Whitelist Rule window.
Generating Reports
Use the Reports tab to select one of the three on-demand Threat Report templates (defined below), and then click either Display, Delete or Edit to modify the report presentation.
Select the Executive Report option to generate an Executive summary of all threats categorized by malware severity for all detection times.
Select the Technical Report option to generate a Technical summary of all threats for all detection times [in HTML format by default], named Recent Malware Report. Reports for System Audit and System Health are also available.
- Report Types and Options
- Customizing Reports
- Executive Report
- Technical Report
- System Audit Report
- System Health Report
Report Types and Options
Each report type displays a set of custom options, as shown below.
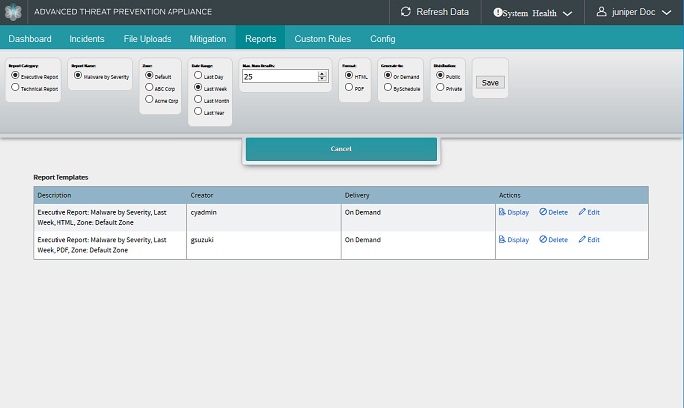
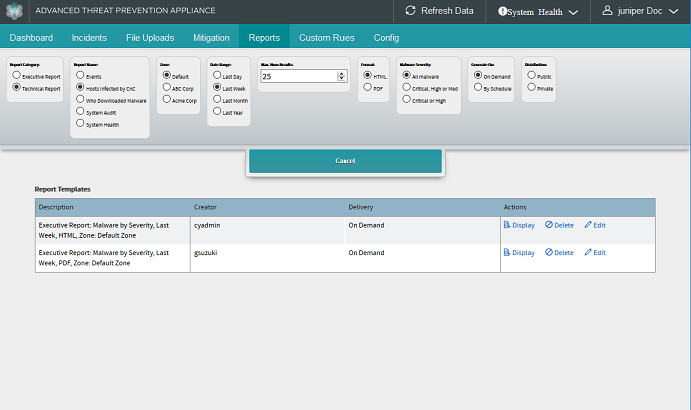
Click Display to display the report in a browser window.
Click Delete to delete a report template from the list.
Click Edit to modify a report template; the "Edit" and "Customize" options are identical [see Customize Reports options below].
Customizing Reports
To customize report(s), click the blue Create a Custom Report Template button, make selections, and click Save to preserve modified or customized template settings.
Custom template options are described below:
Executive Report
Refer to the section Sample Executive Report Segments for an overview of the main segments published to Executive Reports.
Options for creating a custom Executive Report:
Report Name |
Malware by Severity |
Date Range |
Options: Last Day | Last Week | Last Month | Last Year. |
Maximum Number of Results |
Enter the number of results to display in the report [the default is 25]. |
Format |
Options: HTML or PDF. |
Generate |
Options: On Demand | By Schedule. |
Days |
Options: Mon | Tues | Wed | Thurs | Fri | Sat | Sun |
Time |
Enter time in format 00:00 am or pm |
Recipient(s) email |
Enter email address(es), separated by commas. |
Technical Report
Options for creating a custom Technical Report:
Report Name |
Events | Hosts Infected by CnC | Who Downloaded Malware | System Audit | System Health |
Date Range |
Options: Last Day | Last Week | Last Month | Last Year. |
Maximum Number of Results |
Enter the number of results to display in the report [the default is 25]. |
Format |
Options: HTML or PDF. |
Malware Severity |
Options: All Malware | Critical, High or Med | Critical or High |
Generate |
Options: On Demand | By Schedule. |
Days |
Options: Mon | Tues | Wed | Thurs | Fri | Sat | Sun |
Time |
Enter time in format 00:00 am or pm |
Recipient(s) email |
Enter email address(es), separated by commas. |
System Audit Report
Options for creating a custom System Audit Report:
Report Name |
System Audit |
Event Type |
Select the event type(s) to include in the alert notification: Login/Logout | Failed logins | Add/Update Users | System Settings | Restarts | System Health |
Users |
Select All Users or Current User for the notification report. |
Date Range |
To filter the report notification by time period, select one: Last Day | Last Week | Last Month | Last Year |
Max Num Results |
Enter the number of rows of results to include in the alert notification [default is 25]. |
Format |
Select HTML or PDF as the notification output format. |
Generate |
Options: On Demand | By Schedule. |
Days |
Options: Mon | Tues | Wed | Thurs | Fri | Sat | Sun |
Time |
Enter time in format 00:00 am or pm |
Recipient(s) email |
Enter email address(es), separated by commas. |
System Health Report
Options for creating a custom System Health Report:
Report Name |
System Audite |
Health |
Select Overall Health or Processing Delay for the health report. |
Format |
Select HTML or PDF as the notification output format. |
Generate |
Options: On Demand | By Schedule |
Days |
Options: Mon | Tues | Wed | Thurs | Fri | Sat | Sun |
Time |
Enter time in format 00:00 am or pm |
Recipient(s) email |
Enter email address(es), separated by commas. |
Sample Executive Report Segments
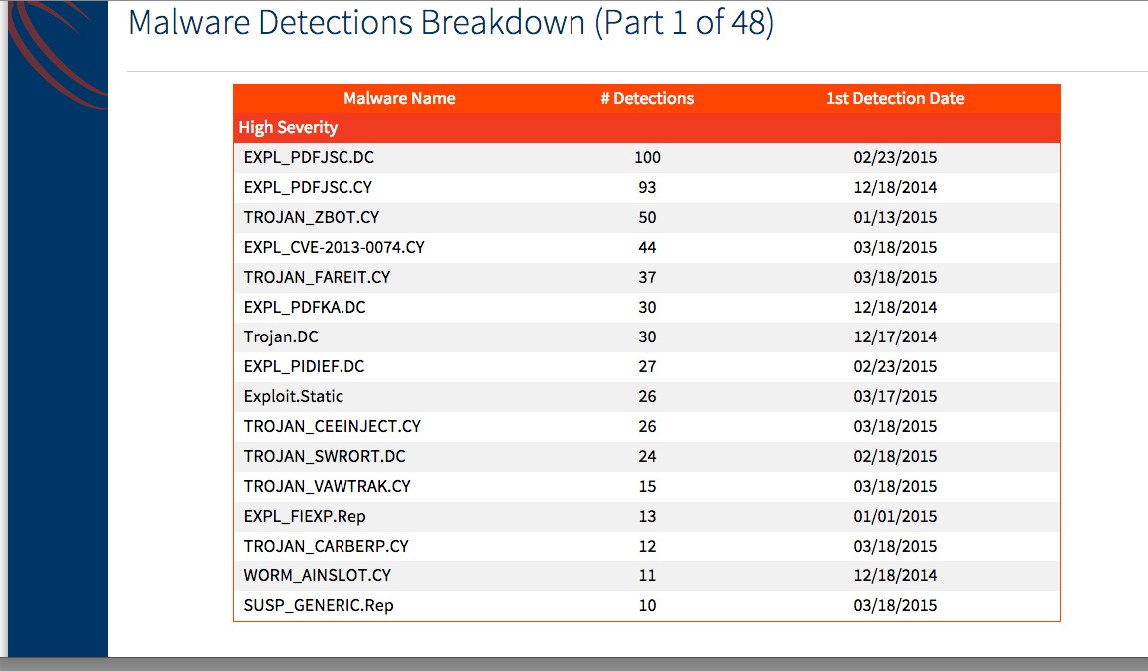
Some of the main categories of information and statistics provided in a Juniper ATP Appliance Executive Report are shown in the series of samples below:
- Traffic Statistics
- Malware Statistics
- File Statistics by Operating System
- Malware Types
- Malware Vector & Detection Engine
- Kill Chain Breakdown
- Top Malware Serving Countries
- Malware Detections Breakdown (Part 1)
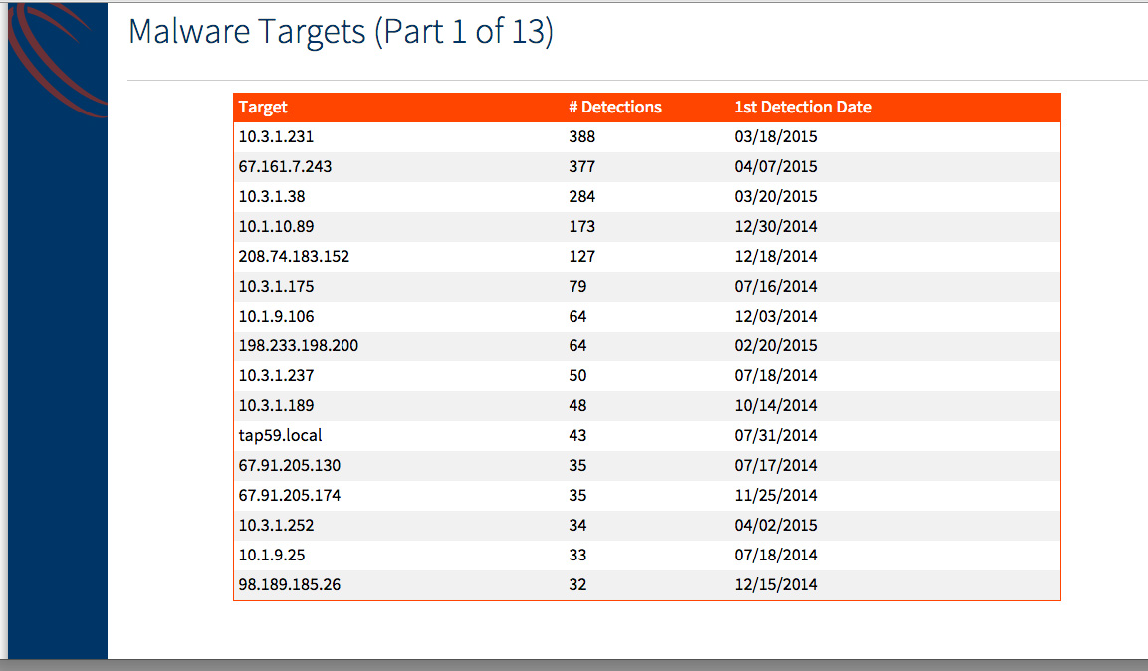
- Malware Targets (Part 1)
Traffic Statistics
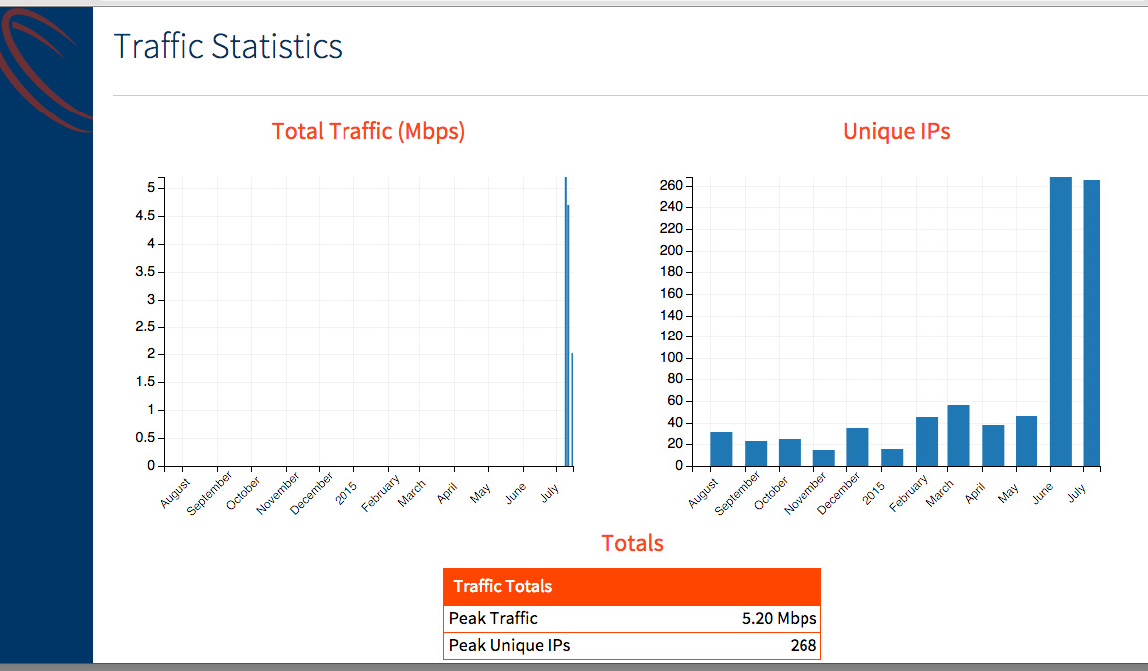
Total Traffic(Mbps): The total traffic seen by the Core.
Unique IPs: The count of unique Internal or destination IPs seen by the Core.
Malware Statistics
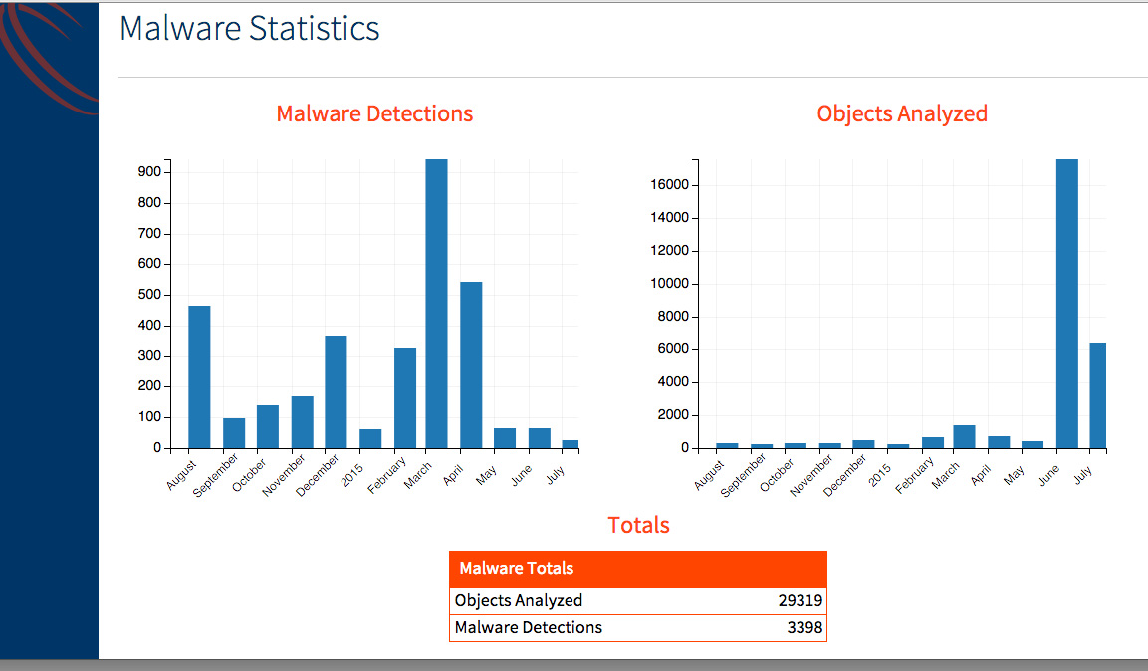
Objects Analyzed: The number of downloadable files detected by the Core and analyzed.
Malware Detections: Total number of threats identified by the Core in the network.
File Statistics by Operating System
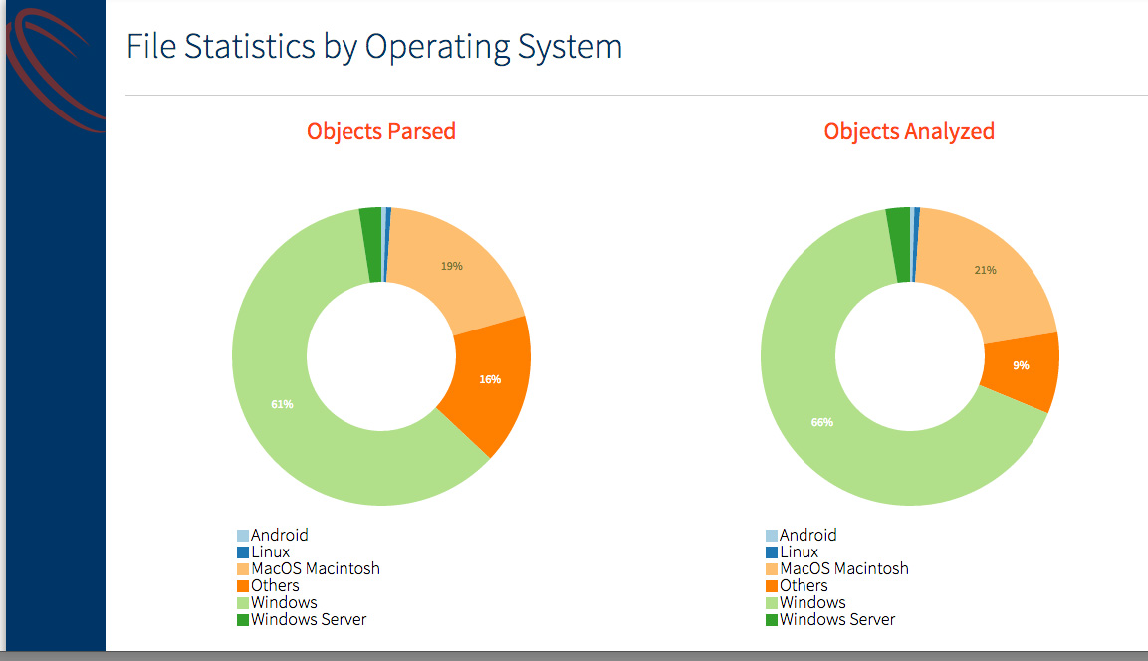
Objects Parsed: Percentage of the different files seen by the Core in the network.
Objects Analyzed: Percentage of the different files analyzed by the Core in the network. This is always a subset of objects parsed. A few of the files such as jpeg, gif, txt etc. that are parsed are not analyzed in the Core.
Malware Types
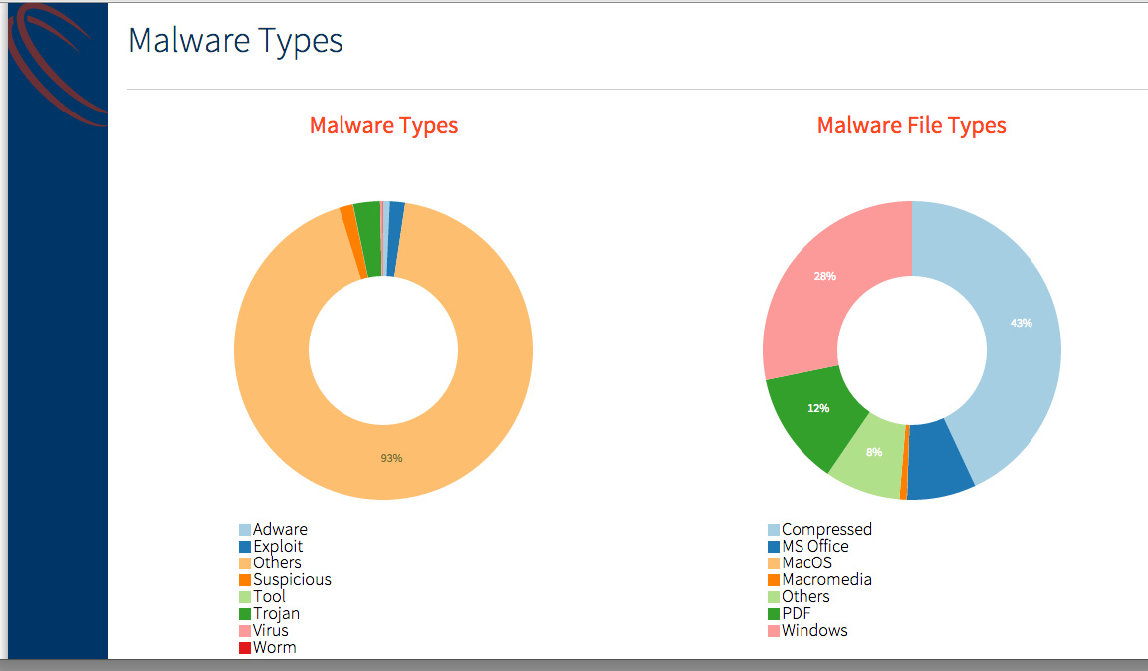
Malware Types: The categories of the malware as seen by the Core.
Malware File Types: Percentage of the different file types that were detected as malware by the Core.
Malware Vector & Detection Engine
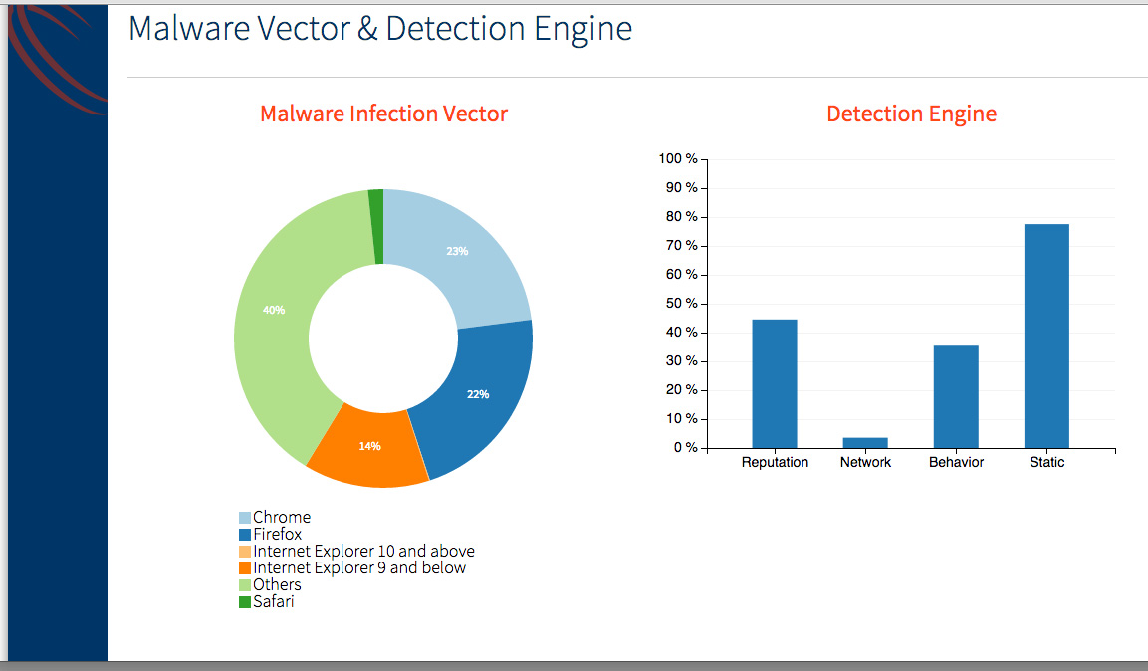
Malware Infection Vector: Percentage of Malware per Browser type.
Detection Engine: Percentage of Malware detected by the Core by various detection engines.
Kill Chain Breakdown
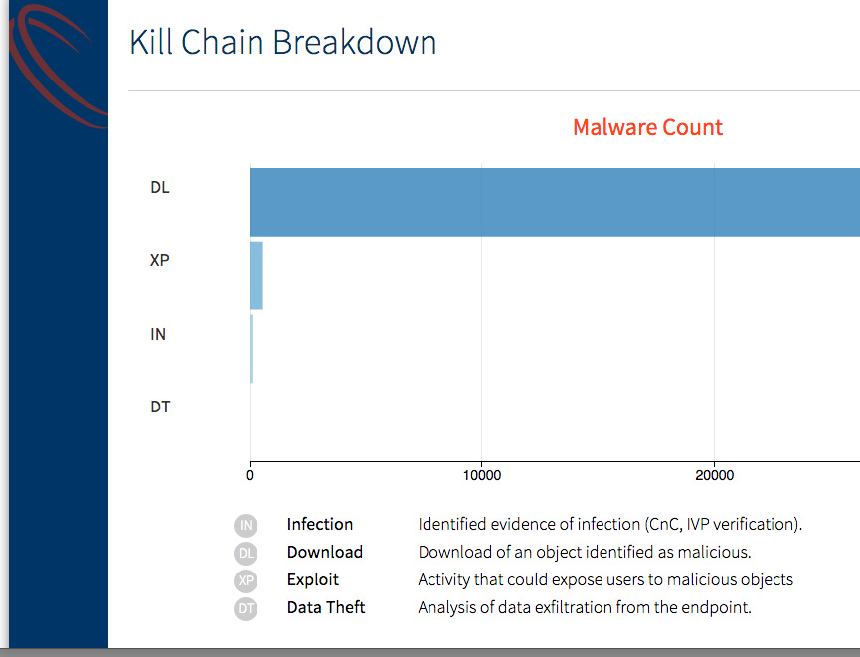
Kill Chain Breakdown: Total count of Malware detected by various kill chains.
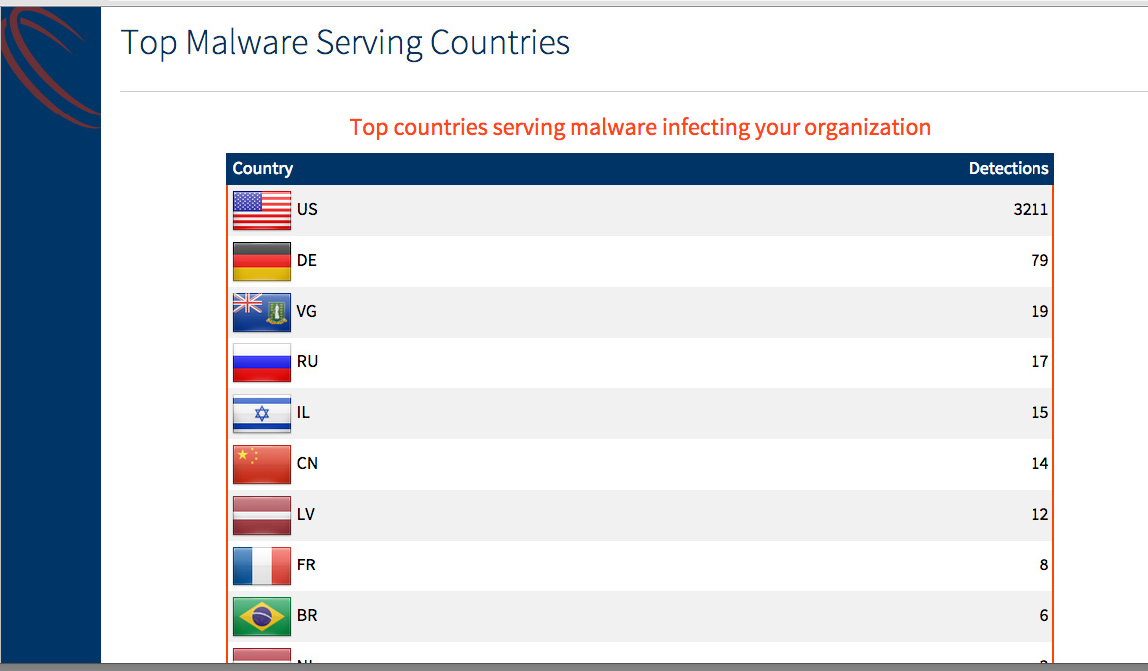
Top Malware Serving Countries
Malware Detections Breakdown (Part 1)
Malware Targets (Part 1)
