Configurable Categories of Metrics Collection and Reporting (Tech Preview)
SUMMARY In Cloud-Native Contrail® Networking™ Release 22.2, you can enable and disable selected metrics for exporting.
Overview: Configurable Categories of Metrics Collection and Reporting
To provide more flexibility in the telemetry export component, Cloud-Native Contrail
Networking Release 22.2 introduces a new Kubernetes custom resource:
MetricGroup. MetricGroup allows you to enable
or disable selected metrics for exporting.
MetricGroupcontains and manages a set of metrics for exporting.- Metrics are grouped by their category. You can choose to enable or disable the metric export function at the group level.
MetricGroupis implemented through a Kubernetes custom resource.
MetricGroup provides fine-grained control on what metrics the system
collects and reports. You can turn on and off subset of metrics reporting. Sometimes
administrators want to collect only a subset of metrics for efficiency and the
lightest weight possible deployment.
This feature is classified as a Juniper CN2 Technology Preview feature. These features are "as is" and are for voluntary use. Juniper Support will attempt to resolve any issues that customers experience when using these features and create bug reports on behalf of support cases. However, Juniper may not provide comprehensive support services to Tech Preview features.
For additional information, refer to the Juniper CN2 Technology Previews (Tech Previews) or contact Juniper Support.

Telemetry Operator, see Figure 1, monitors any change of metric groups. Based on the enabled
metric groups, a list of enabled metrics is created and sent in the form of
ConfigMap to metric export agents. Metric export agents
collect and export these enabled metrics, instead of all metrics on the system.
- The
MetricGroupreconciler builds aConfigMapfor each type of metric (vrouterorcontroller) from the enabledMetricGroup(s) and applies theConfigMapto all clusters. - The KubeManager reconciler does the same for a new cluster.
Telemetry Exporter combines metric specifications with this
ConfigMap to create an enabled metric specifications. The
metric export function only exports metrics from the enabled metric specifications,
instead of all metrics.
Following items list YAML values for ConfigMap and
MetricGroup.
ConfigMap: vrouter-export-enabled-metrics
- Revision number.
- Array of enabled metric names.
Custom Resource: MetricGroup
- Type: vrouter or controller
- Name: String
- Export: Boolean
- Metrics: Array of strings (metric name)
Install and Upgrade
MetricGroup is included in the analytics component in the CN2
Release 22.2. The predefined metric groups are automatically installed during
the CN2 analytics deployment. See Install Contrail Analytics for Upstream
Kubernetes or Install Contrail Analytics for OpenShift
Container Platform.
Example: Predefined Metric Group
Bgpaas Controller-bgp Controller-info Controller-peer Controller-xmpp Ermvpn Evpn Ipv4 Ipv6 Mvpn Vrouter-cpu Vrouter-info Vrotuer-inv6 Vrouter-mem Vrouter-traffic Vrouter vmi
Example predefined MetricGroup: vrouter-cpu
YAML file:
apiVersion: telemetry.juniper.net/v1alpha1 kind: MetricGroup metadata: name: vrouter-cpu namespace: contrail-analytics spec: export: true metricType: VROUTER metrics: - virtual_router_cpu_1min_load_avg - virtual_router_cpu_5min_load_avg - virtual_router_cpu_15min_load_avg
Manage MetricGroup with Kubectl Commands
You (the administrator) can manage MetricGroup with
kubectl commands. Examples follow.
To delete MetricGroup:
kubectl delete metricgroup ipv6 –n contrail-analytics
To apply MetricGroup:
kubectl apply –f <yaml file with metric group definition>
To view MetricGroup resource:
kubectl get metricgroup ipv4 –n contrail-analytics –oyaml
To verify the existence following ConfigMap(s). Each cluster has its
own copy of these two ConfigMap(s).
kubectl get cm –n contrail
Names of ConfigMap
controller-export-enabled-metrics
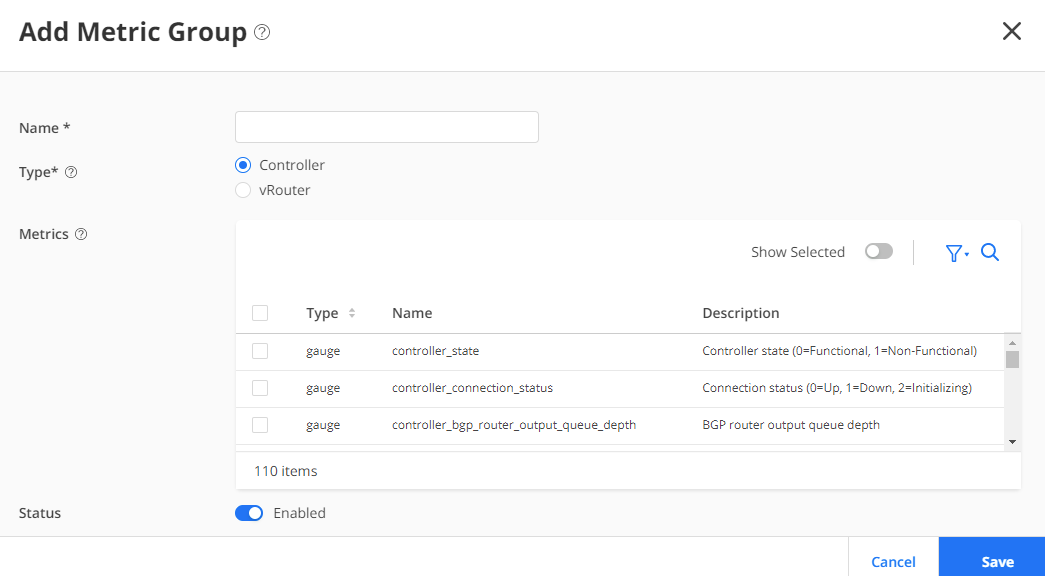
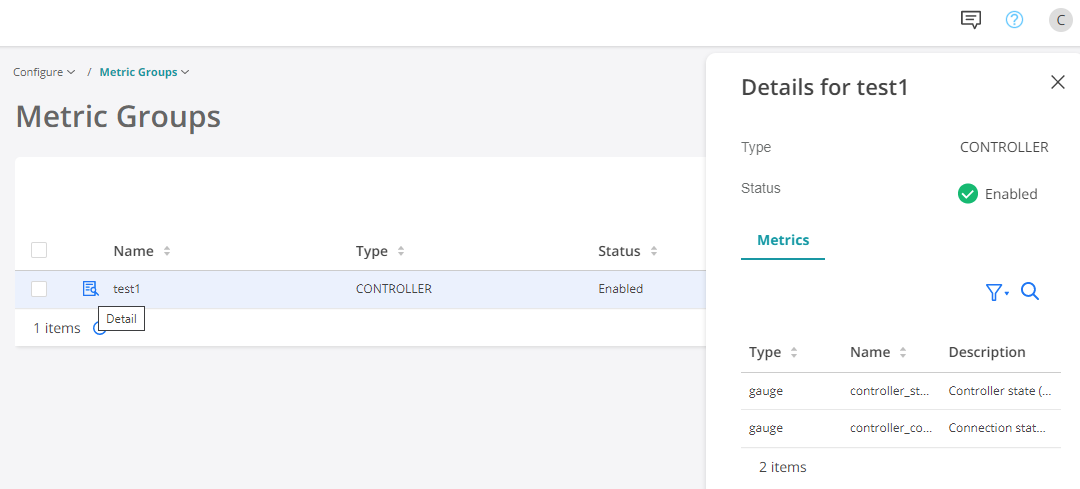
vrouter-export-enabled-metricsManage Metric Groups with UI
MetricGroups using the CN2 Manager UI.To manage Metric Groups in the UI:


