Viewing Cluster Node Details and Metric Values
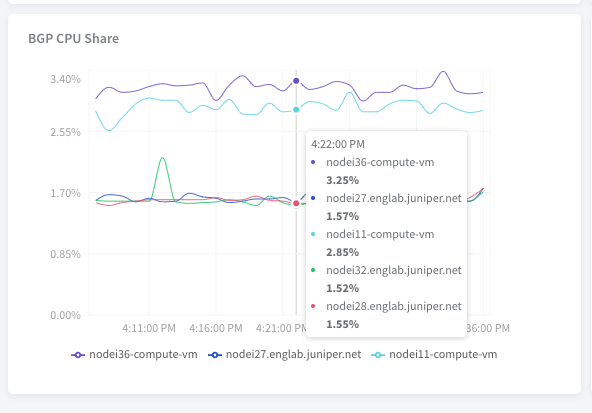
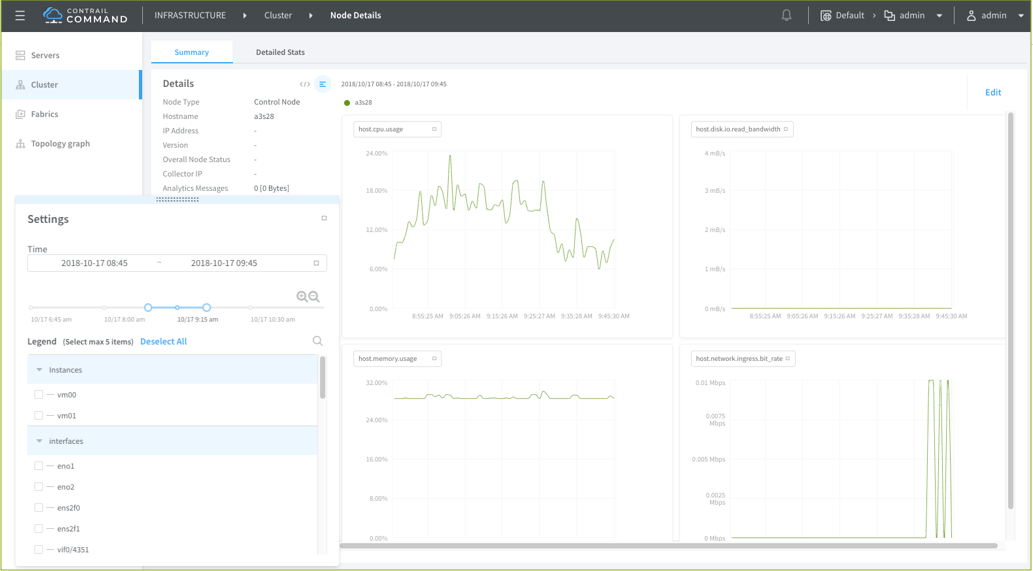
With Node Details and host charts, you can view real-time and historical values of all metrics that AppFormix monitors. Charts provide you with a way to view metrics for multiple entities across layers and organized by physical host, project, or aggregate. The charts update with the latest data streamed from the AppFormix Platform without needing to refresh. You can select which entities to display on the charts, and select the time period that is displayed. When you hover over the charts, a pop-up box shows the actual values for the selected entities at a specific point in time. Figure 2 shows real-time metric values streamed from AppFormix.
In order to view host charts, your AppFormix license subscription must be active.
Time
The Time in the Settings dialog box (see Figure 2) provides navigation to a specific point in time that you want to view. Use the time and date drop-down list to select a range. Using the range selected, you can use the time slider to fine tune the time range by scaling up or down. This time range is used to query data that will be drawn in the visualizations.
Legend
The Legend shows which entities are currently being displayed in the charts. See Figure 2. You can select a subset of entities to display to improve the clarity of the charts and focus on specific entities. The first five series are selected by default. The entity list is categorized and searchable in the Settings dialog box.
Chart Data Values
The host charts show the latest data for up to four different metrics, updating in real-time from a stream of data from the AppFormix Platform. When the cursor is positioned over the charts, a pop-up box shows the data values at that particular time. Charts can be zoomed in or out by opening the Settings dialog box and adjusting the time range. Four charts are displayed on the Dashboard at all times.

Viewing Cluster Node Details and Host Charts
To view cluster node details and charts:
Select Infrastructure > Cluster > Cluster Nodes.
Select the Control Nodes name to view node details.
In the Summary tab page, by default, basic information for the selected host is listed. Use the toggle button to switch between the textual information list and a JSON view for further technical processing.
Figure 2: Real-Time Metric Values Streamed from the AppFormix Platform
In the Settings dialog box, set the time range and legend. With an active AppFormix subscription, you have access to the Appformix data source and a separate 4-charts dashboard will show on the right to provide visualizations of data metrics.
Time—For time range selection, use the time/date drop-down list to select a range. Using the range selected from the drop-down, use the time slider to fine tune (narrowing down or scaling up) the time range at a fixed step. This time range is used to query data that will be drawn in the visualizations.
Legend—For legend or list of series, use the expanded list to add or remove entities drawn in a chart.
Select the Detailed Stats tab to view the following:
Figure 3: Node Detailed Stats for Peers, Routes, and AlarmsPeers—Includes JSON values, peer type, peer ASN, status, and messages count.
Routes—Includes routing table JSON values, prefix, protocol, next hop, label, security group, and origin virtual-network object (VN).
Alarms—Includes severity, time, alarm type, and source.

