Monitor > Infrastructure > Control Nodes
Use Monitor > Infrastructure > Control Nodes to gain insight into usage statistics for control nodes.
Monitor Control Nodes Summary
Select Monitor > Infrastructure > Control Nodes to see a graphical chart of average memory usage versus average CPU percentage usage for all control nodes in the system. Also on this screen is a list of all control nodes in the system. See Figure 1. See Table 1 for descriptions of the fields on this screen.
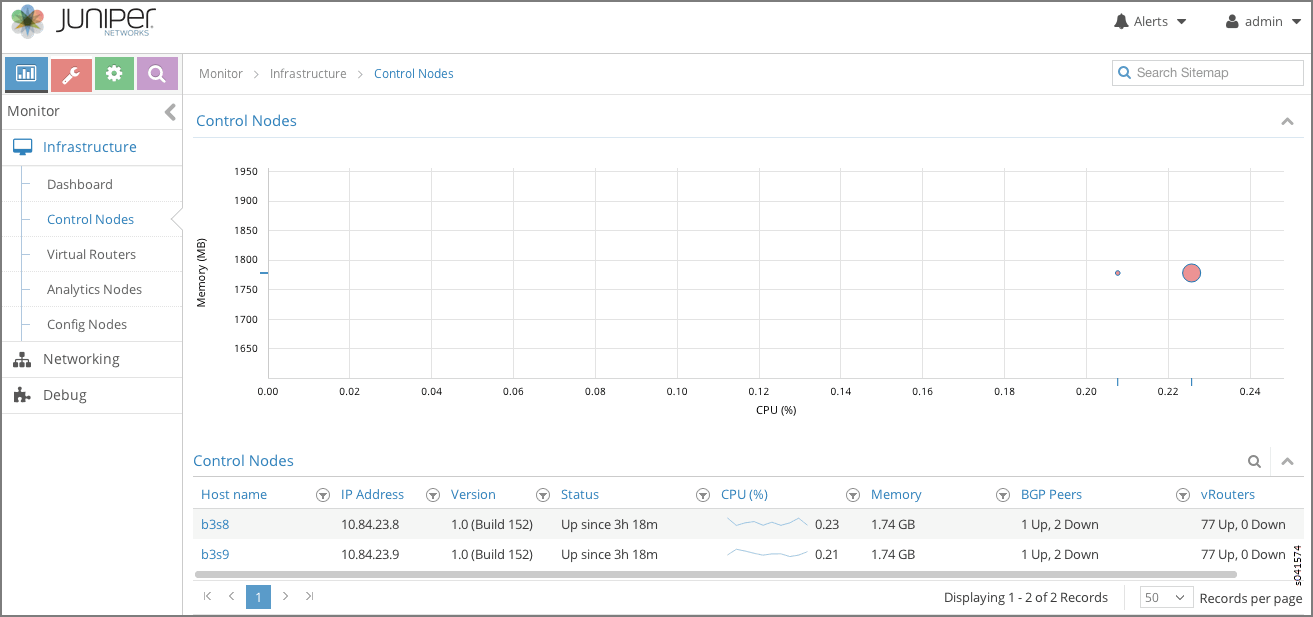
Field |
Description |
|---|---|
Host name |
The name of the control node. |
IP Address |
The IP address of the control node. |
Version |
The software version number that is installed on the control node. |
Status |
The current operational status of the control node — Up or Down. |
CPU (%) |
The CPU percentage currently in use by the selected control node. |
Memory |
The memory in MB currently in use and the total memory available for this control node. |
Total Peers |
The total number of peers for this control node. |
Established in Sync Peers |
The total number of peers in sync for this control node. |
Established in Sync vRouters |
The total number of vRouters in sync for this control node. |
Monitor Individual Control Node Details
Click the name of any control nodes listed under the Control Nodes title to view an array of graphical reports of usage and numerous details about that node. There are several tabs available to help you probe into more details about the selected control node. The first tab is the Details tab; see Figure 2.
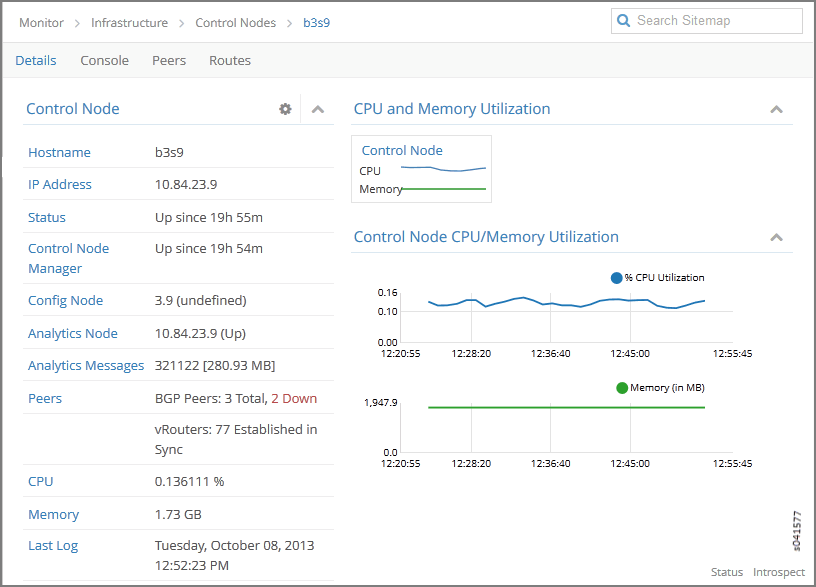
The Details tab provides a summary of the status and activity on the selected node, and presents graphical displays of CPU and memory usage. See Table 2 for descriptions of the fields on this tab.
Field |
Description |
|---|---|
Hostname |
The host name defined for this control node. |
IP Address |
The IP address of the selected node. |
Status |
The operational status of the control node. |
Control Node Manager |
The operational status of the control node manager. |
Config Node |
The IP address of the configuration node associated with this control node. |
Analytics Node |
The IP address of the node from which analytics (monitor) information is derived. |
Analytics Messages |
The total number of analytics messages in and out from this node. |
Peers |
The total number of peers established for this control node and how many are in sync and of what type. |
CPU |
The average percent of CPU load incurred by this control node. |
Memory |
The average memory usage incurred by this control node. |
Last Log |
The date and time of the last log message issued about this control node. |
Control Node CPU/Memory Utilization |
A graphic display x, y chart of the average CPU load and memory usage incurred by this control node over time. |
Monitor Individual Control Node Console
Click the Console tab for an individual control node to display system logging information for a defined time period, with the last 5 minutes of information as the default display. See Figure 3.
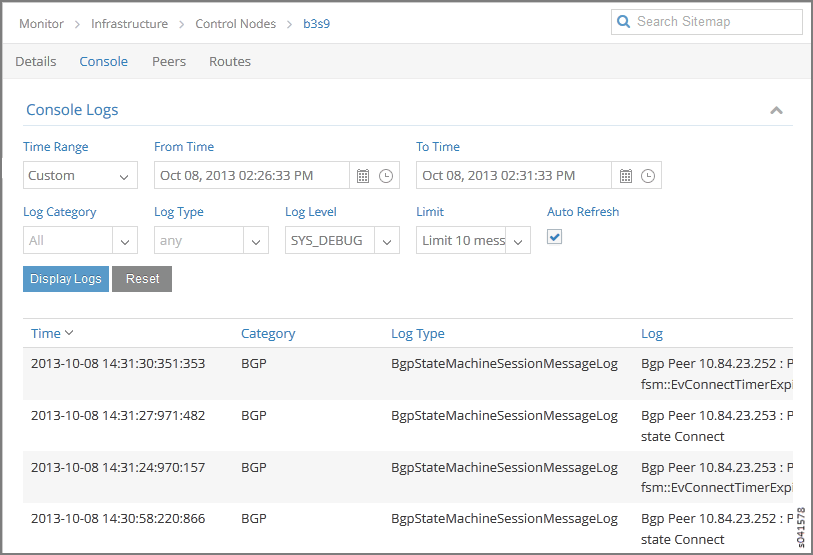
See Table 3 for descriptions of the fields on the Console tab screen.
Field |
Description |
|---|---|
Time Range |
Select a timeframe for which to review logging information as sent to the console. There are 11 options, ranging from the Last 5 mins through to the Last 24 hrs. The default display is for the Last 5 mins. |
Log Category |
Select a log category to display:
|
Log Type |
Select a log type to display. |
Log Level |
Select a log severity level to display:
|
Search |
Enter any text string to search and display logs containing that string. |
Limit |
Select from a list an amount to limit the number of messages displayed:
|
Auto Refresh |
Click the check box to automatically refresh the display if more messages occur. |
Display Logs |
Click this button to refresh the display if you change the display criteria. |
Reset |
Click this button to clear any selected display criteria and reset all criteria to their default settings. |
Time |
This column lists the time received for each log message displayed. |
Category |
This column lists the log category for each log message displayed. |
Log Type |
This column lists the log type for each log message displayed. |
Log |
This column lists the log message for each log displayed. |
Monitor Individual Control Node Peers
The Peers tab displays the peers for an individual control node and their peering state. Click the expansion arrow next to the address of any peer to reveal more details. See Figure 4.
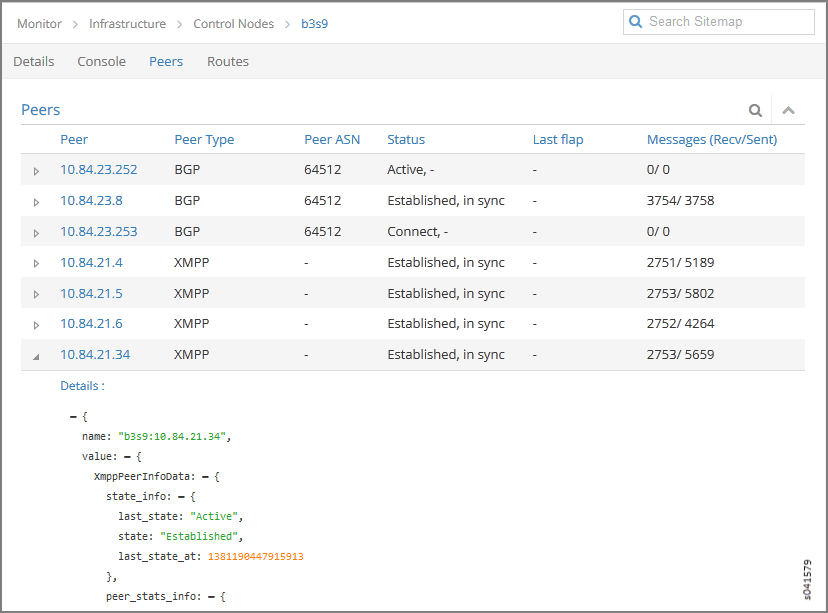
See Table 4 for descriptions of the fields on the Peers tab screen.
Field |
Description |
|---|---|
Peer |
The hostname of the peer. |
Peer Type |
The type of peer. |
Peer ASN |
The autonomous system number of the peer. |
Status |
The current status of the peer. |
Last flap |
The last flap detected for this peer. |
Messages (Recv/Sent) |
The number of messages sent and received from this peer. |
Monitor Individual Control Node Routes
The Routes tab displays active routes for this control node and lets you query the results. Use horizontal and vertical scroll bars to view more results. Click the expansion icon next to a routing table name to reveal more details about the selected route. See Figure 5.
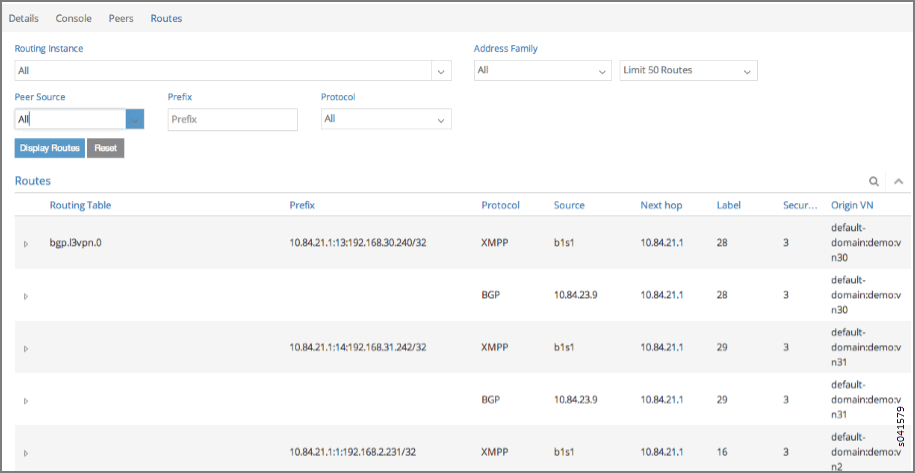
See Table 5 for descriptions of the fields on the Routes tab screen.
Field |
Description |
|---|---|
Routing Instance |
You can select a single routing instance from a list of all instances for which to display the active routes. |
Address Family |
Select an address family for which to display the active routes:
|
(Limit Field) |
Select to limit the display of active routes:
|
Peer Source |
Select from a list of available peers the peer for which to display the active routes, or select All. |
Prefix |
Enter a route prefix to limit the display of active routes to only those with the designated prefix. |
Protocol |
Select a protocol for which to display the active routes:
|
Display Routes |
Click this button to refresh the display of routes after selecting different display criteria. |
Reset |
Click this button to clear any selected criteria and return the display to default values. |
Column |
Description |
Routing Table |
The name of the routing table that stores this route. |
Prefix |
The route prefix for each active route displayed. |
Protocol |
The protocol used by the route. |
Source |
The host source for each active route displayed. |
Next hop |
The IP address of the next hop for each active route displayed. |
Label |
The label for each active route displayed. |
Security |
The security value for each active route displayed. |
Origin VN |
The virtual network from which the route originates. |
AS Path |
The AS path for each active route displayed. |
