ON THIS PAGE
Monitor > Infrastructure > Virtual Routers
Monitor vRouters Summary
Click Monitor > Infrastructure > Virtual Routers to view the vRouters summary screen. See Figure 1.
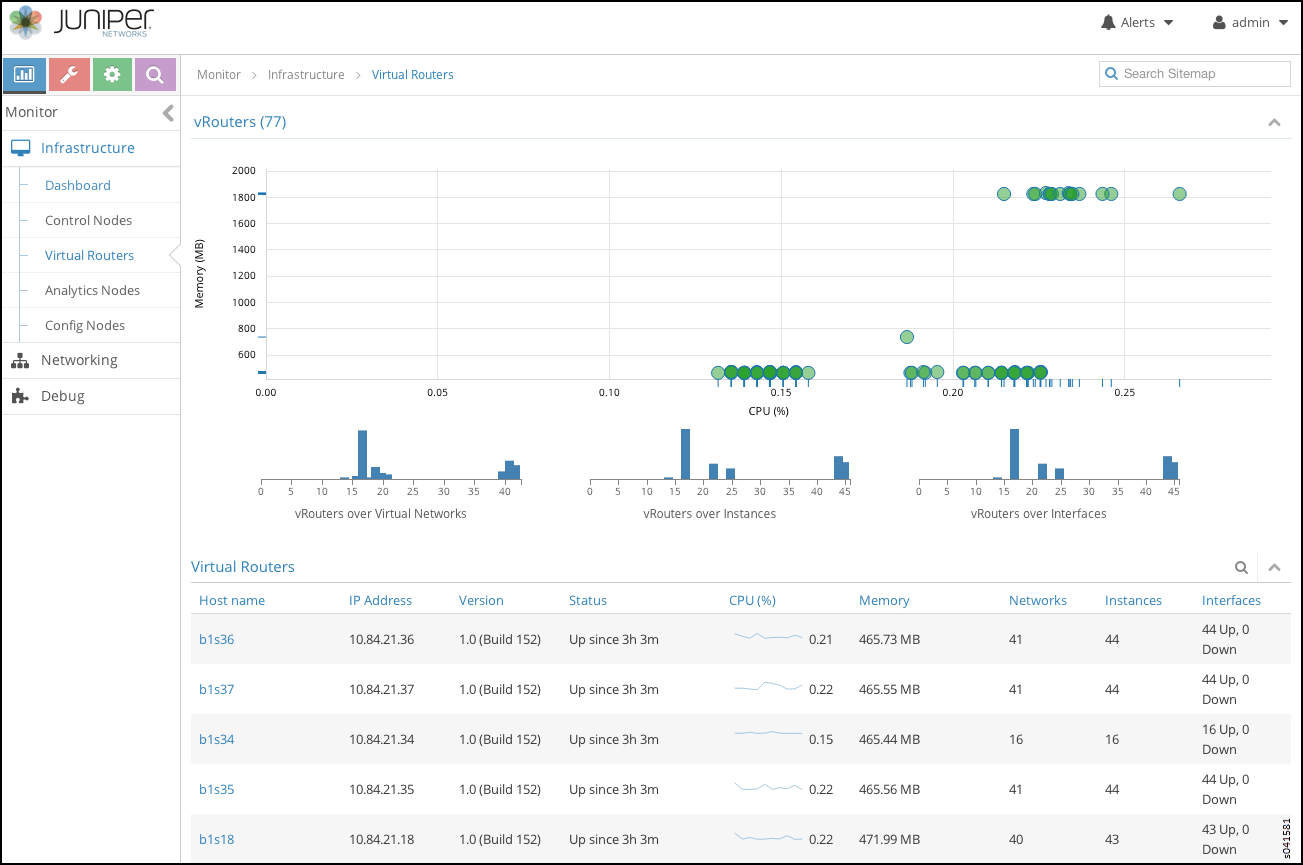
See Table 1 for descriptions of the fields on the vRouters Summary screen.
Field |
Description |
|---|---|
Host name |
The name of the vRouter. Click the name of any vRouter to reveal more details. |
IP Address |
The IP address of the vRouter. |
Version |
The version of software installed on the system. |
Status |
The current operational status of the vRouter — Up or Down. |
CPU (%) |
The CPU percentage currently in use by the selected vRouter. |
Memory (MB) |
The memory currently in use and the total memory available for this vRouter. |
Networks |
The total number of networks for this vRouter. |
Instances |
The total number of instances for this vRouter. |
Interfaces |
The total number of interfaces for this vRouter. |
Monitor Individual vRouters Tabs
Click the name of any vRouter to view details about performance and activities for that vRouter. Each individual vRouters screen has the following tabs.
Details—similar display of information as on individual control nodes Details tab. See Figure 2.
Console—similar display of information as on individual control nodes Console tab. See Figure 8.
Interfaces—details about associated interfaces. See Figure 3.
Networks—details about associated networks. See Figure 4.
ACL—details about access control lists. See Figure 5.
Flows—details about associated traffic flows. See Figure 6.
Routes—details about associated routes. See Figure 7.
Monitor Individual vRouter Details Tab
The Details tab provides a summary of the status and activity on the selected node, and presents graphical displays of CPU and memory usage; see Figure 2. SeeTable 2 for descriptions of the fields on this tab.
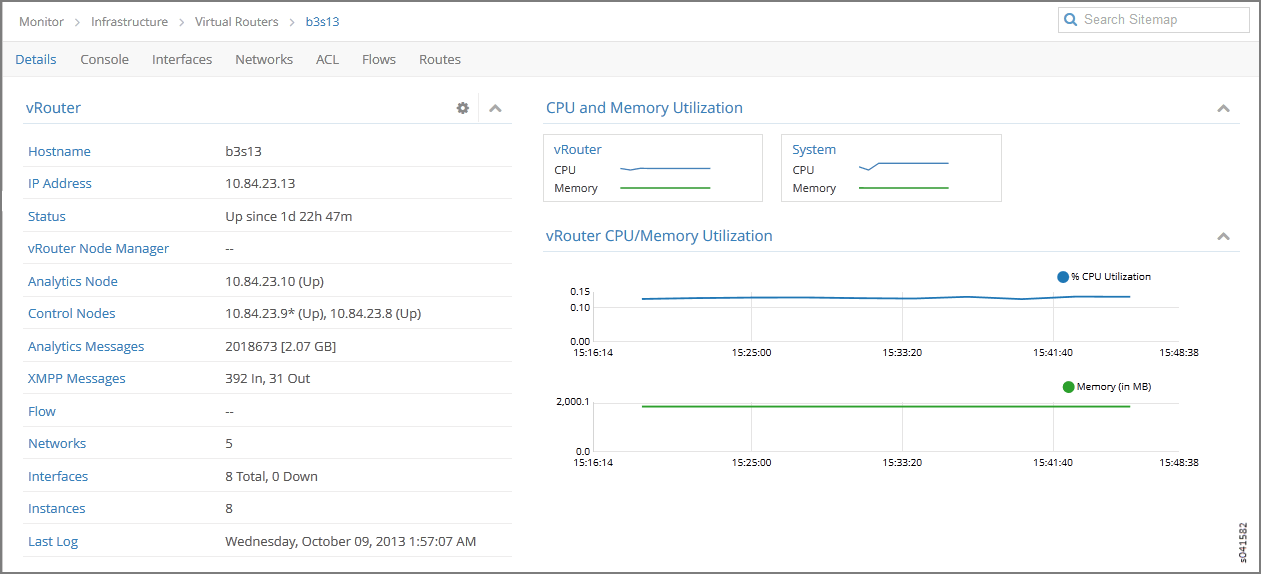
Field |
Description |
|---|---|
Hostname |
The hostname of the vRouter. |
IP Address |
The IP address of the selected vRouter. |
Status |
The operational status of the vRouter. |
vRouter Node Manager |
The operational status of the vRouter node manager. |
Analytics Node |
The IP address of the node from which analytics (monitor) information is derived. |
Control Nodes |
The IP address of the configuration node associated with this vRouter. |
Analytics Messages |
The total number of analytics messages in and out from this node. |
XMPP Messages |
The total number of XMPP messages that have gone in and out of this vRouter. |
Flow |
The number of active flows and the total flows for this vRouter. |
Networks |
The number of networks associated with this vRouter. |
Interfaces |
The number of interfaces associated with this vRouter. |
Instances |
The number of instances associated with this vRouter. |
Last Log |
The date and time of the last log message issued about this vRouter. |
vRouter CPU/Memory Utilization |
Graphs (x, y) displaying CPU and memory utilization averages over time for this vRouter, in comparison to system utilization averages. |
Monitor Individual vRouters Interfaces Tab
The Interfaces tab displays details about the interfaces associated with an individual vRouter. Click the expansion arrow next to any interface name to reveal more details. Use horizontal and vertical scroll bars to access all portions of the screen. See Figure 3. See Table 3 for descriptions of the fields on the Interfaces tab screen.
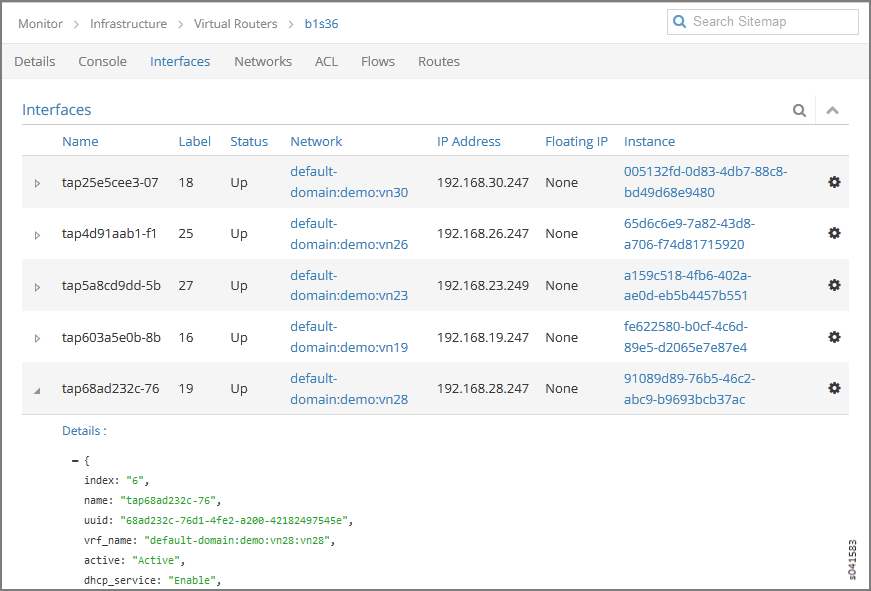
Field |
Description |
|---|---|
Name |
The name of the interface. |
Label |
The label for the interface. |
Status |
The current status of the interface. |
Network |
The network associated with the interface. |
IP Address |
The IP address of the interface. |
Floating IP |
Displays any floating IP addresses associated with the interface. |
Instance |
The name of any instance associated with the interface. |
Monitor Individual vRouters Networks Tab
The Networks tab displays details about the networks associated with an individual vRouter. Click the expansion arrow at the name of any network to reveal more details. See Figure 4. See Table 4 for descriptions of the fields on the Networks tab screen.
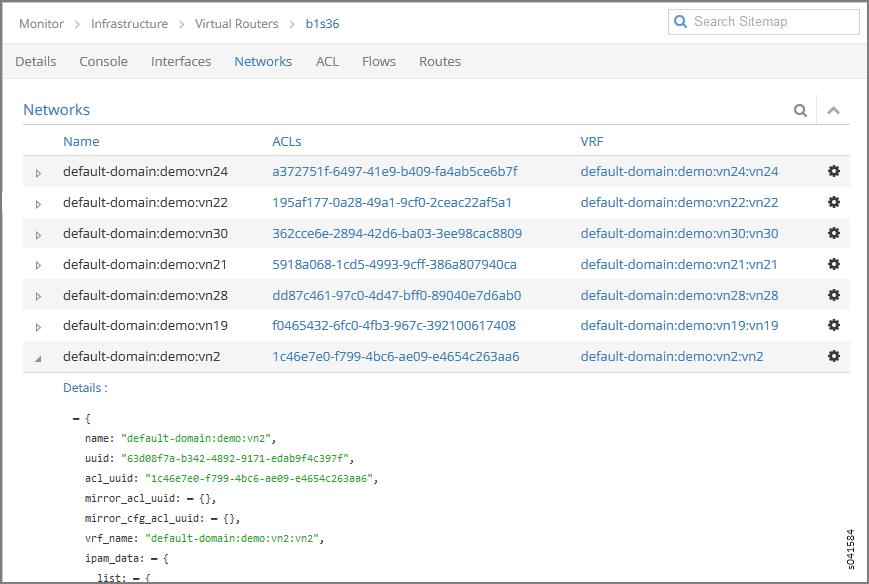
Field |
Description |
|---|---|
Name |
The name of each network associated with this vRouter. |
ACLs |
The name of the access control list associated with the listed network. |
VRF |
The identifier of the VRF associated with the listed network. |
Action |
Click the icon to select the action: Edit, Delete |
Monitor Individual vRouters ACL Tab
The ACL tab displays details about the access control lists (ACLs) associated with an individual vRouter. Click the expansion arrow next to the UUID of any ACL to reveal more details. See Figure 5. See Table 5 for descriptions of the fields on the ACL tab screen.
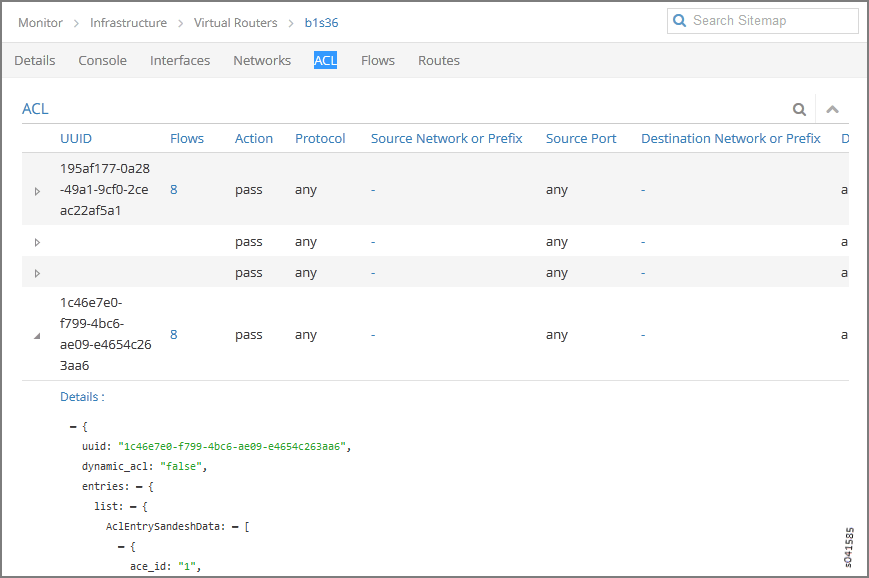
Field |
Description |
|---|---|
UUID |
The universal unique identifier (UUID) associated with the listed ACL. |
Flows |
The flows associated with the listed ACL. |
Action |
The traffic action defined by the listed ACL. |
Protocol |
The protocol associated with the listed ACL. |
Source Network or Prefix |
The name or prefix of the source network associated with the listed ACL. |
Source Port |
The source port associated with the listed ACL. |
Destination Network or Prefix |
The name or prefix of the destination network associated with the listed ACL. |
Destination Port |
The destination port associated with the listed ACL. |
ACE Id |
The ACE ID associated with the listed ACL. |
Monitor Individual vRouters Flows Tab
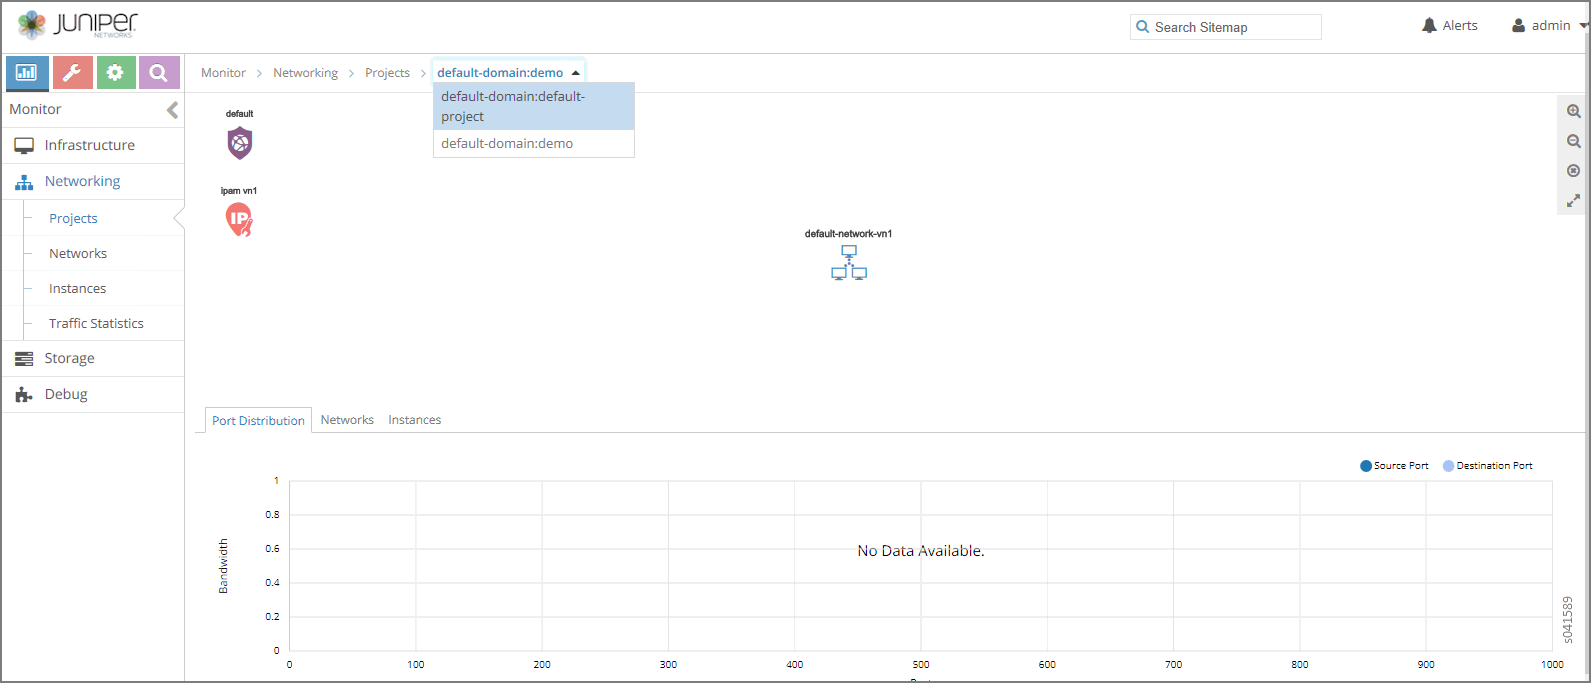
The Flows tab displays details about the flows associated with an individual vRouter. Click the expansion arrrow next to any ACL/SG UUID to reveal more details. Use the horizontal and vertical scroll bars to access all portions of the screen. See Figure 6. See Table 6 for descriptions of the fields on the Flows tab screen.
Field |
Description |
|---|---|
ACL UUID |
The default is to show All flows, however, you can select from a drop down list any single flow to view its details. |
ACL / SG UUID |
The universal unique identifier (UUID) associated with the listed ACL or SG. |
Protocol |
The protocol associated with the listed flow. |
Src Network |
The name of the source network associated with the listed flow. |
Src IP |
The source IP address associated with the listed flow. |
Src Port |
The source port of the listed flow. |
Dest Network |
The name of the destination network associated with the listed flow. |
Dest IP |
The destination IP address associated with the listed flow. |
Dest Port |
The destination port associated with the listed flow. |
Bytes/Pkts |
The number of bytes and packets associated with the listed flow. |
Setup Time |
The setup time associated with the listed flow. |
Monitor Individual vRouters Routes Tab
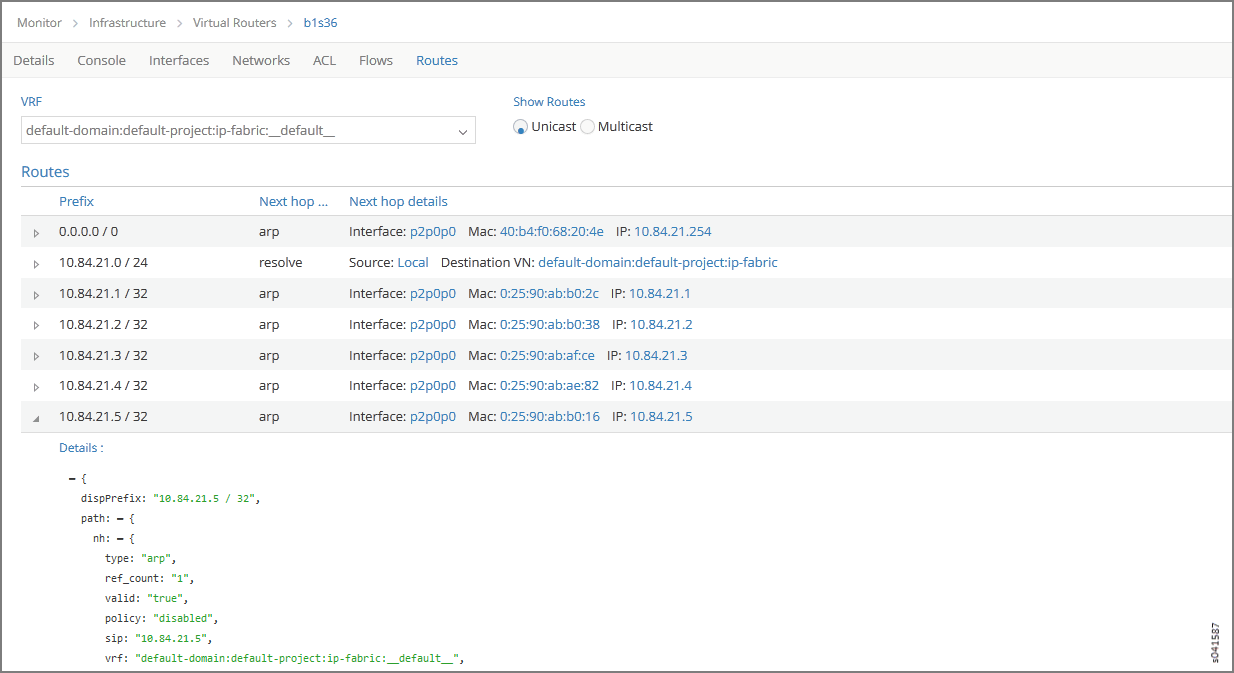
The Routes tab displays details about unicast and multicast routes in specific VRFs for an individual vRouter. Click the expansion arrow next to the route prefix to reveal more details. See Figure 7. See Table 7 for descriptions of the fields on the Routes tab screen.
Field |
Description |
|---|---|
VRF |
Select from a drop down list the virtual routing and forwarding (VRF) to view. |
Show Routes |
Select to show the route type: Unicast or Multicast. |
Prefix |
The IP address prefix of a route. |
Next hop |
The next hop method for this route. |
Next hop details |
The next hop details for this route. |
Monitor Individual vRouter Console Tab
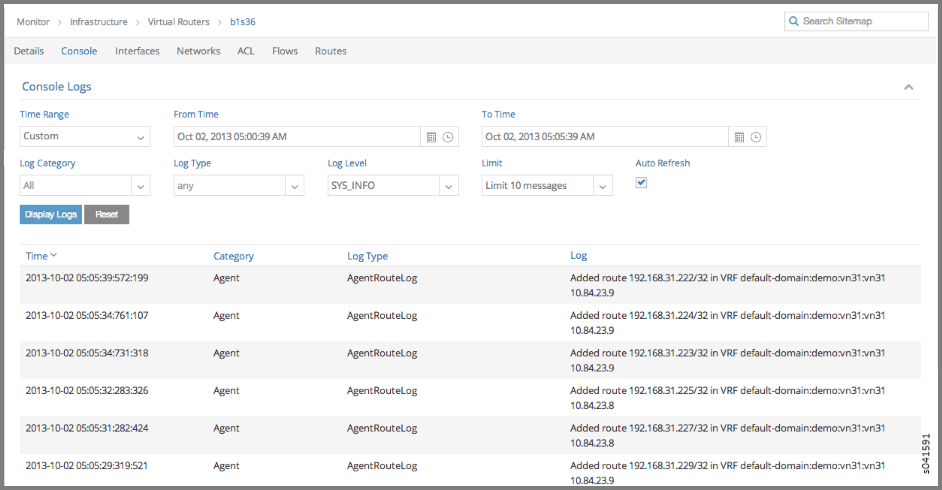
Click the Console tab for an individual vRouter to display system logging information for a defined time period, with the last 5 minutes of information as the default display. See Figure 8. See Table 8 for descriptions of the fields on the Console tab screen.
Field |
Description |
|---|---|
Time Range |
Select a timeframe for which to review logging information as sent to the console. There are several options, ranging from Last 5 mins through to the Last 24 hrs, plus a Custom time range. |
From Time |
If you select Custom in Time Range, enter the start time. |
To Time |
If you select Custom in Time Range, enter the end time. |
Log Category |
Select a log category to display:
|
Log Type |
Select a log type to display. |
Log Level |
Select a log severity level to display:
|
Limit |
Select from a list an amount to limit the number of messages displayed:
|
Auto Refresh |
Click the check box to automatically refresh the display if more messages occur. |
Display Logs |
Click this button to refresh the display if you change the display criteria. |
Reset |
Click this button to clear any selected display criteria and reset all criteria to their default settings. |
Columns |
|
Time |
This column lists the time received for each log message displayed. |
Category |
This column lists the log category for each log message displayed. |
Log Type |
This column lists the log type for each log message displayed. |
Log |
This column lists the log message for each log displayed. |
