Viewing the Network Topology
Starting with Contrail Networking Release 1907, the Contrail Command UI provides visual representation of the network topology. All devices within a fabric are displayed in a single view.
Topology view is supported in Contrail Insights (formerly AppFormix) version 2.19.11 and later.
The Topology view supports basic manipulations such as dragging nodes, zooming in and out, fitting to view, in addition to having different layout visualizations. User-edited network layout is saved in the database so any change in network devices layout is preserved across sessions.
Topology view displays the following:
-
Network devices
-
Hosts
-
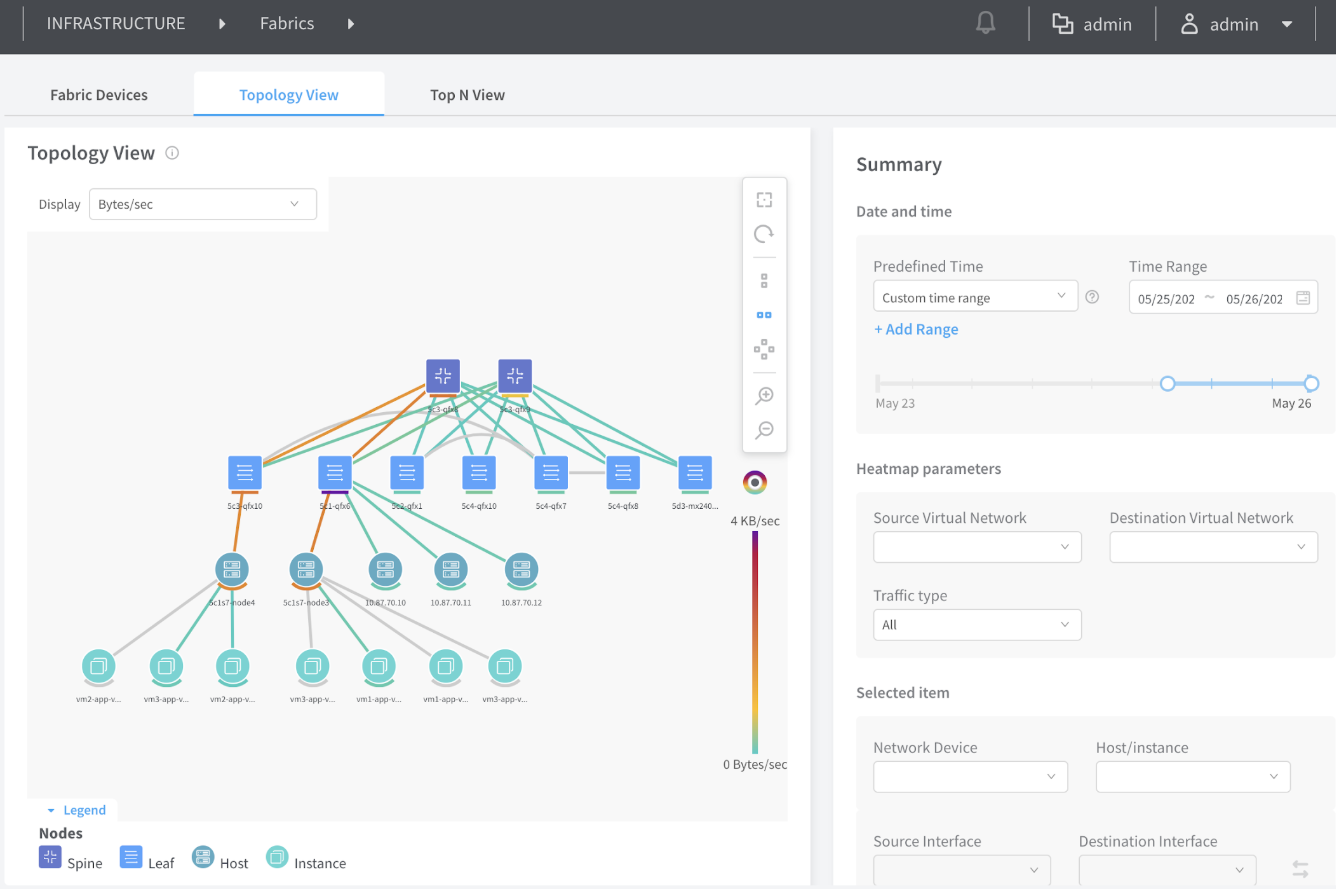
Compute instances in hosts
-
Edges connecting network devices and Contrail Networking vRouter hosts but not bare metal server (BMS) alone.
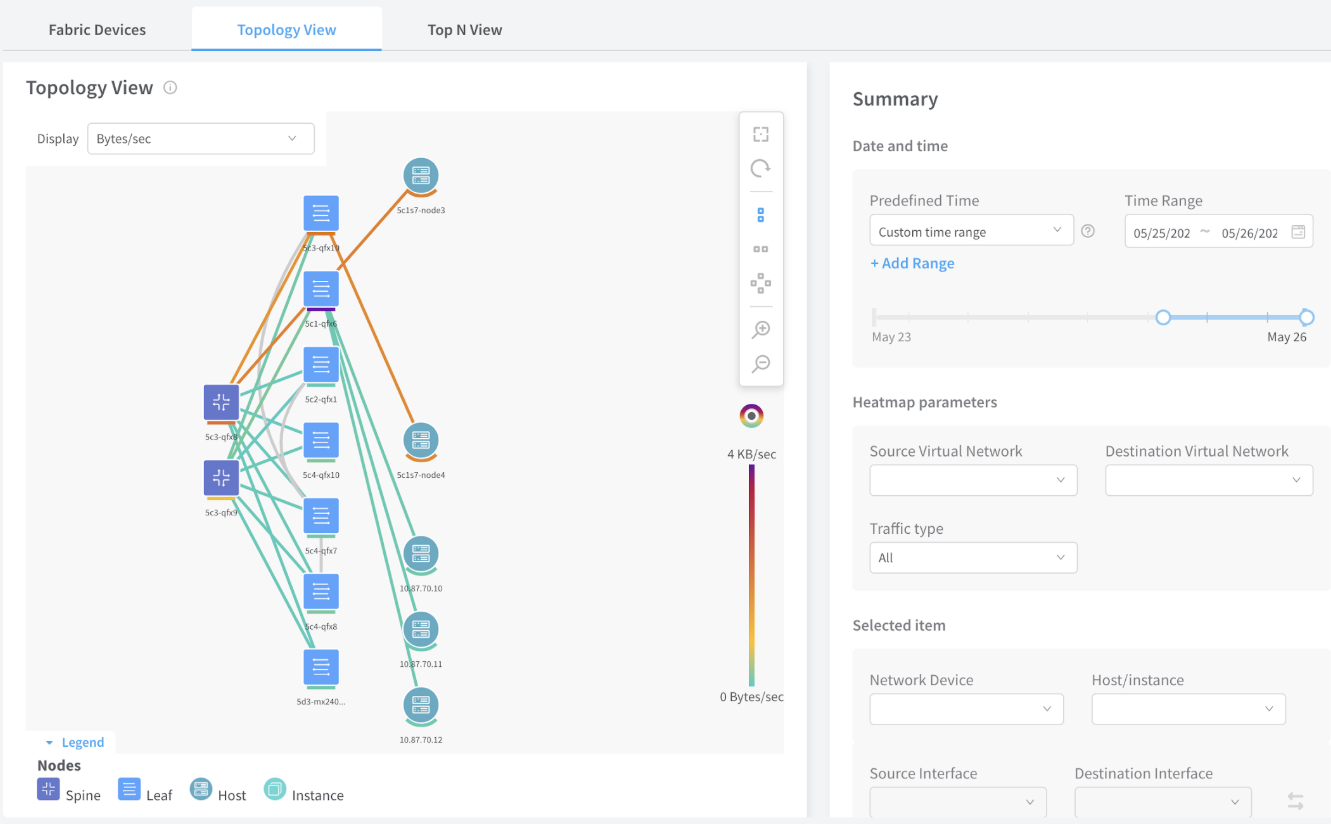
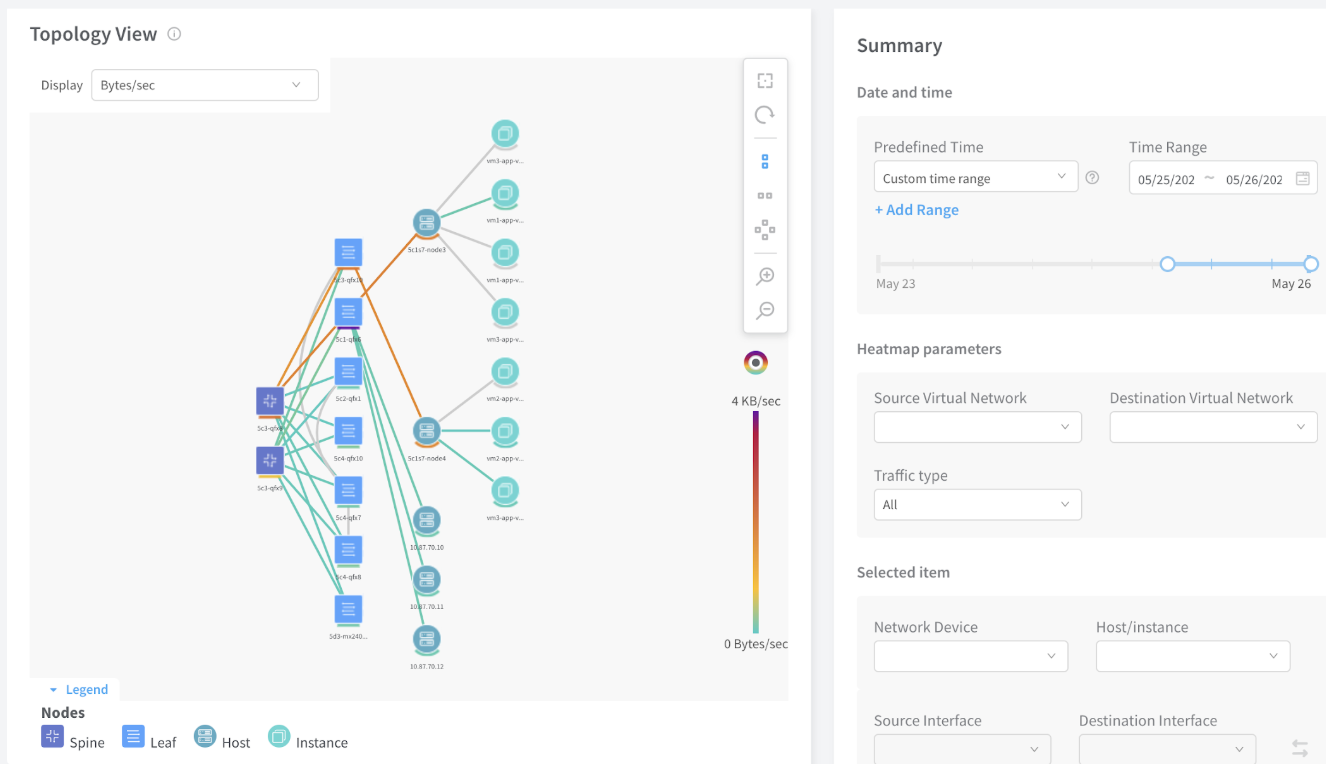
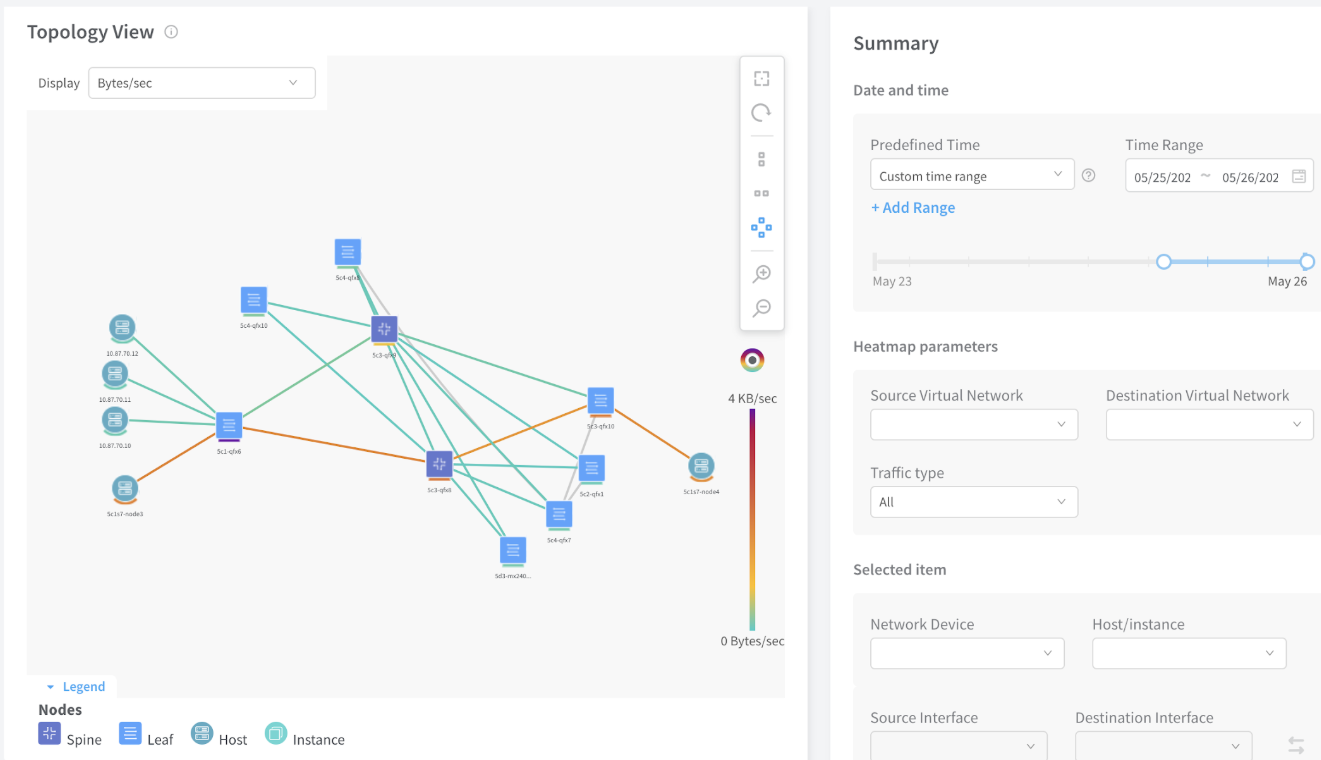
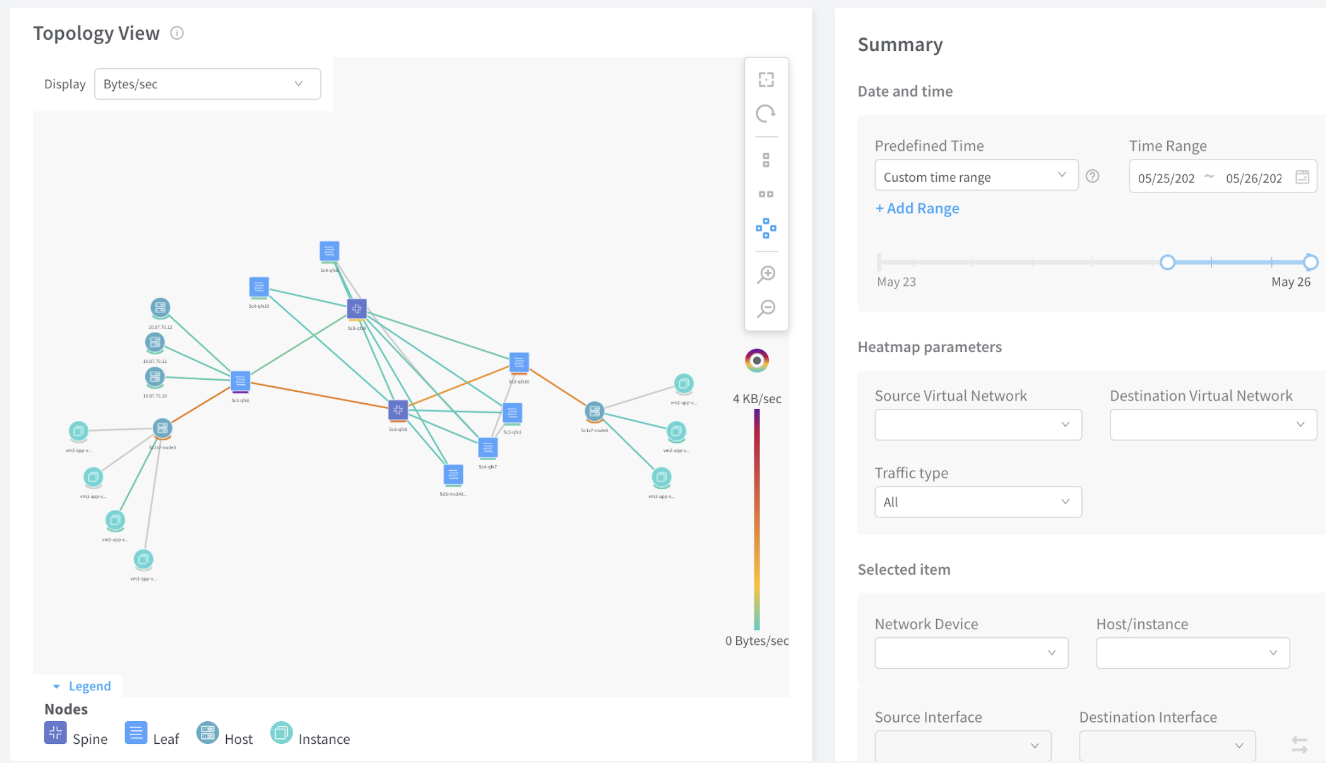
Three views are supported:
-
Horizontal
-
Vertical
-
Radial
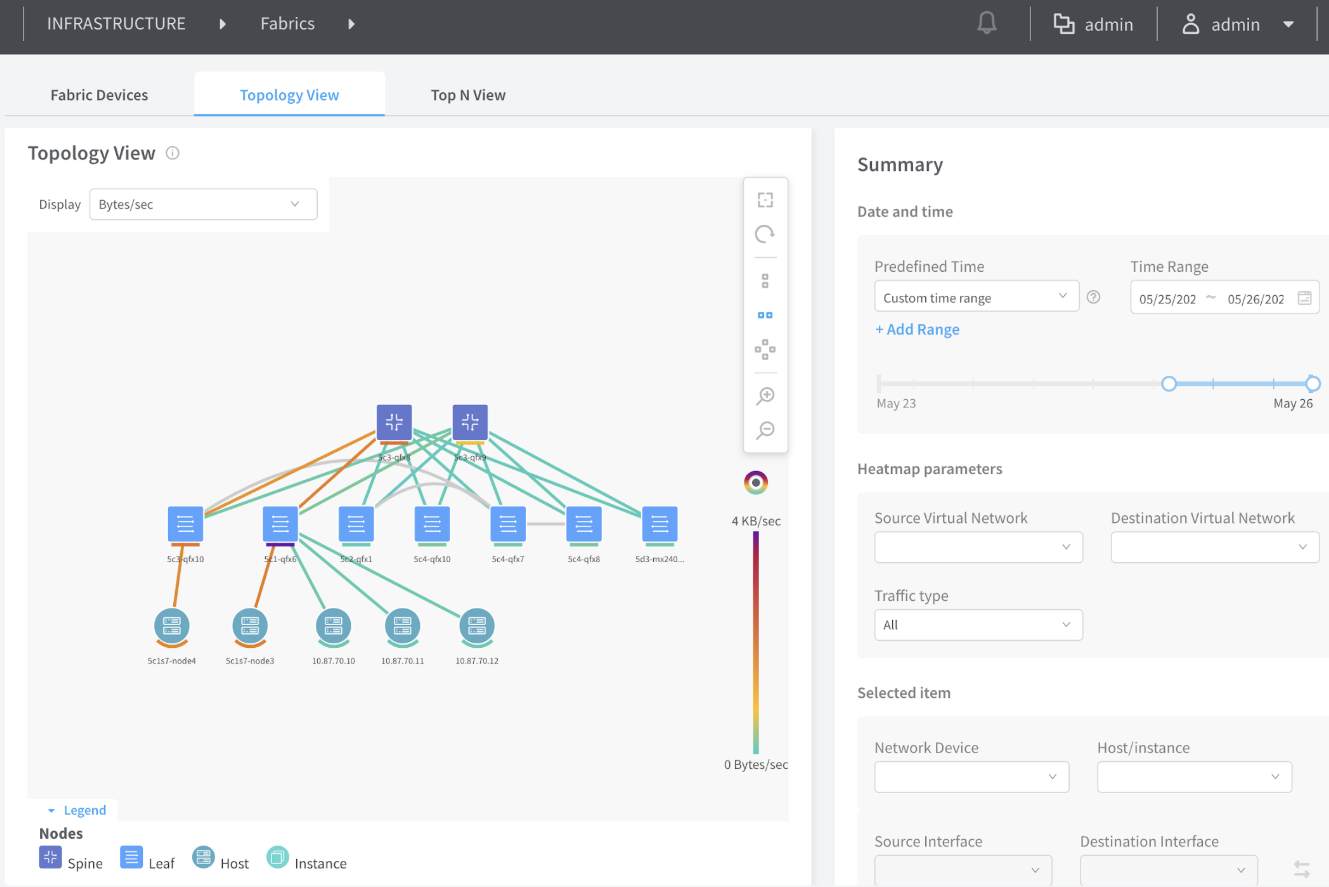
The topology heatmap shows network and server resources used in real-time or historically. For example, data center operators can see the bytes per second or the link utilization inside the network, or the CPU resources being consumed by a specific server or virtual machine.
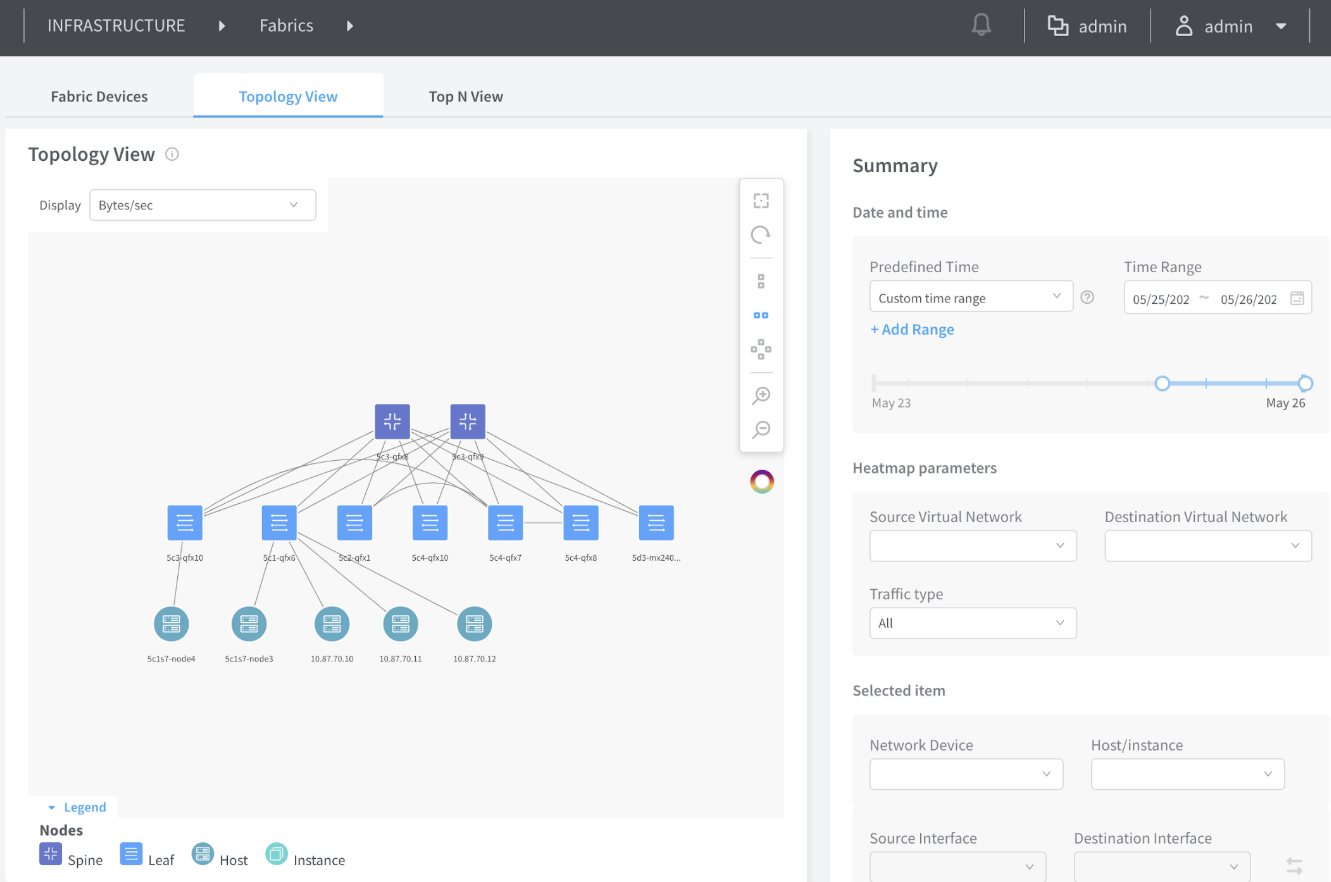
Select Infrastructure > Fabrics > <fabric name> > Topology View. From the Display drop-down list, select an option to filter data viewed. Mouse over the nodes and interfaces in the Topology View for more detail.
To change views, select an icon in the vertical tool bar in the Topology View panel. Following are example views. For descriptions of the Summary view options, see Table 1.
|
Summary Options |
Description |
|---|---|
|
Date and time |
|
|
Predefined Time |
Select the period in the history for which data is to be displayed. |
|
Time range |
Use the calendar or type directly into the fields to select the desired start and end time. Additionally, you can select a time interval by dragging the mouse. |
|
Heatmap parameters |
|
|
Source Virtual Network |
Filter data with this source virtual network. |
|
Destination Virtual Network |
Filter data with this destination virtual network. |
|
Traffic type |
Filter data by traffic type, such as All, Multicast, or Other. |
|
Selected item |
|
|
Network Device |
Filter data passing through the network device. |
|
Host/instance |
Filter data with the host compute instance(s), such as Memory Usage or CPU Usage. |
|
Source Interface |
Filter the source interface on the selected network device. |
|
Destination Interface |
Filter the destination interface on the selected network device |
Change History Table
Feature support is determined by the platform and release you are using. Use Feature Explorer to determine if a feature is supported on your platform.