Help us improve your experience.

Let us know what you think.

Do you have time for a two-minute survey?

close
keyboard_arrow_left
Use Case Manager
Table of Contents Expand all
list Table of Contents
file_download PDF
keyboard_arrow_right

Visualizing MITRE Coverage Summary and Trends

date_range 17-May-22

The MITRE summary and trend reports provide an overview of the different tactics that are covered by QRadar Use Case Manager. You can analyze the summary data in table, bar, and radar charts. Only the number of enabled mappings to enabled rules are counted in the charts because disabled mappings don't contribute to your security posture.

If you want to filter by MITRE ATT&CK tactics, you must first map your rules to MITRE tactics and techniques. For more information, see Editing MITRE Mappings in a Rule or Building Block.

  1. Click ATT&CK Actions > Coverage summary and trend in the upper right of the visualization pane.
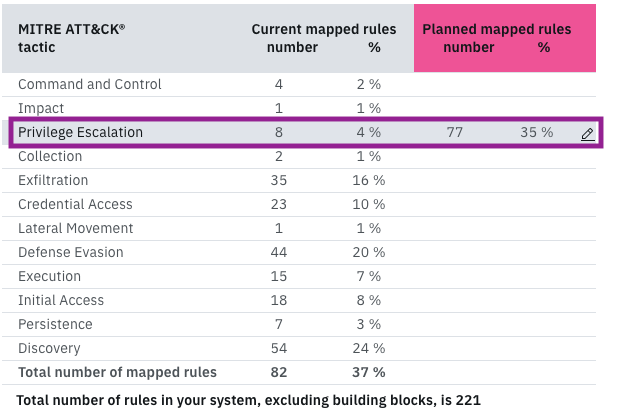
  2. Edit the MITRE Coverage Summary table chart to change the planned number and percentage to see where you're lacking in coverage.

    For example, the current number of rules for the Privilege Escalation tactic is 8 and represents 4% coverage, but you want 35% coverage. When you edit the planned percentage, you see that you need 77 rules to provide the level of coverage you want.

    1. After you add the rule mappings you need to improve your coverage, check the coverage report again to see whether your coverage improved.
    2. Change the date for the chart coverage by clicking the calendar icon for On date. You can change the date as far back as three months before the current date, which is the default.
  3. In the MITRE Coverage Trend chart, click a tactic in the legend to fine-tune the view or view the total coverage trend over time. The default time range is three months. Hover over the vertical line of each day to see the total coverage for each tactic.
  4. To update the charts with live data from QRadar, click the refresh icon. Data is automatically refreshed every 24 hours at night.
  5. To export the summary or trend report, or the entire page, as a PNG image, click the export icon in each relevant section of the page. Then, you can share the images with colleagues or executives who don't have access to QRadar Use Case Manager.
  6. Close the report visualization to return to the dashboard.
external-footer-nav
Ask AI
close

How can I help you today?

LLMs can make mistakes. Verify important information.
chat_add_on New topic
send progress_activity
This conversation will be monitored and recorded. Any information you provide will be subject to our Privacy Notice and may be used for quality assurance purposes. Do not include any personal or sensitive information. Ask AI can make mistakes. Verify generated output for accuracy.
Protected by hCaptcha arrow_drop_down arrow_drop_up
Juniper Networks, Inc. | Privacy Notice | Terms of Use