Access Apstra Data Center Director from Juniper Data Center Assurance
Make sure that you have completed the following:
-
Installed and set up Apstra Edge.
-
Registered Apstra Edge in Juniper Data Center Assurance.
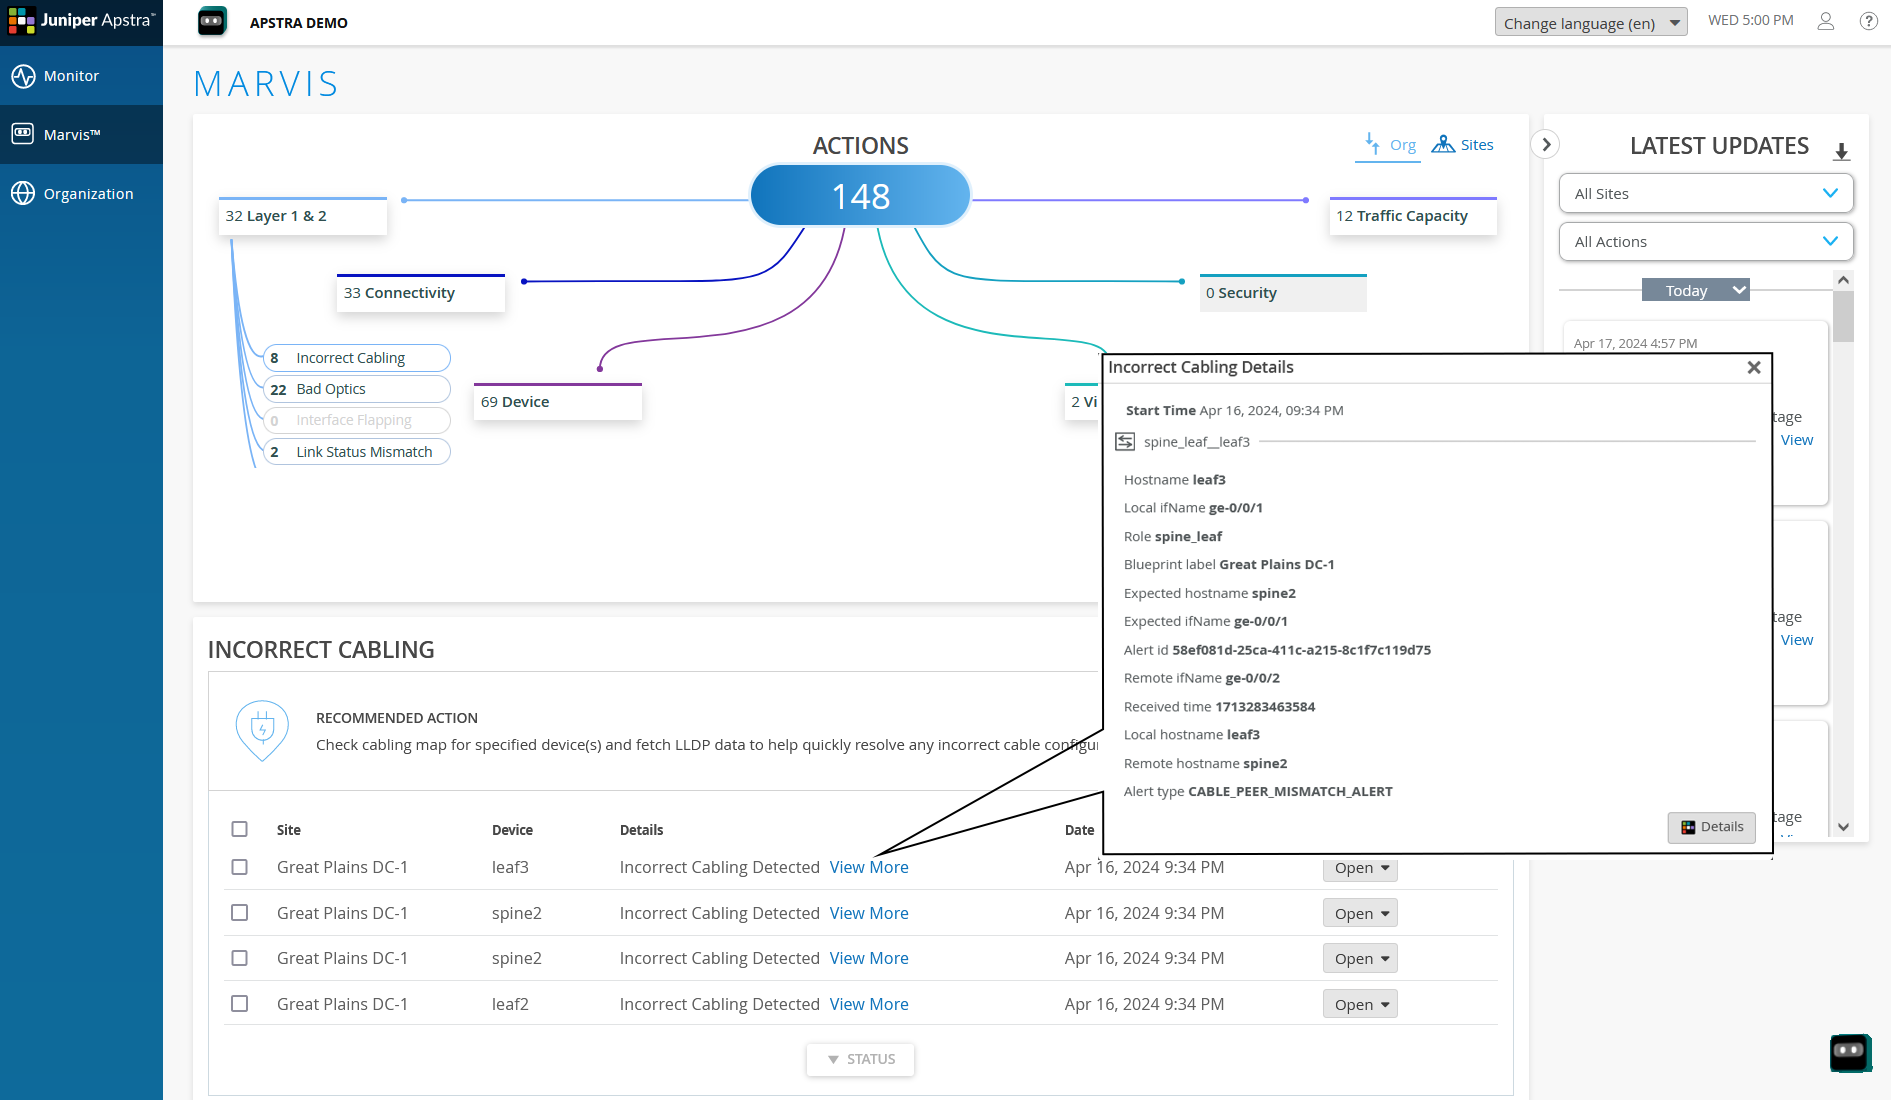
Juniper Data Center Assurance provides detailed insights into the operations of the data center. The events that Juniper Data Center Assurance receives from Apstra Edge are organized in to six event types and displayed in the Marvis Actions dashboard. Each leg in Marvis Actions dashboard corresponds to an event type. You can click the Marvis Actions leg for an event type to view all the events for the selected event type. Click an event to know the reason for the event and recommended resolution. You can then launch Apstra Data Center Director from Juniper Data Center Assurance to troubleshoot and resolve the event. As the information in the Marvis Actions dashboard is real time, network administrators can resolve events even before they impact network traffic.
-
Click View More to view more information about the
event.
A pop-up appears displaying more information about the event.