Overall Service
The Overall Service Tab on the Service Levels page gives you a bird's-eye view of the service levels scores for the entire organization. This Tab displays the aggregated service levels for different sites of the organization.
As an administrator, you can use the Overall Service Tab to get a quick view of all SLEs with low service level scores and the unhealthy routers at different sites. Administrators can use this page as a starting point to identify the unhealthy router or routers that impact the various SLE scores. You can also use this Tab to assess and to compare the overall service level score and the individual SLE scores of different sites.
To view the Overall Service Tab:
Navigate to Monitor > Service Levels > Routing.
Select Entire Org from the site drop-down list.
Click Overall Service.
Select All Sites to view the overall service level of all the sites. Select Worst 100 sites by and choose the SLE from the drop-down list, to view the worst 100 sites by that SLE.
You can view up to 100 sites if you select the Worst 100 sites by option. This option excludes sites with no data for the selected SLE.
You can also view the worst sites over a specific period. Select a time interval from the time range drop-down list. The Overall Service Tab displays the worst sites for the selected time period. Select Custom Date to view the worst sites for a specific date range. Select Custom Range to view the worst sites for a specific date and time range.
Table 1 describes the fields on the Overall Service Tab.
In Figure 1, you can view the overall service level scores of Site A and Site B.
|
Field |
Description |
|---|---|
|
Site |
Name of the site. Click the open icon to view the SLE at the site level in a new Tab. |
|
Average Router Count |
Average router count in the site for the selected period. |
|
Overall Service |
Overall Service Level score of the site. The Overall Service Level is the average percentage of all the SLEs for the site. |
|
Router Health |
Router Health SLE percentage. Click Router Health to navigate to the Router Health Tab. |
|
Router Throughput |
Router Throughput SLE percentage. Click Router Throughput to navigate to the Router Throughput Tab. |
![[ Overall Service Tab on the Service Levels page displaying aggregated service levels for different sites of the organization.]](../../images/s054392.png)
View Router Health SLE at an Organization Level
The Router Health Tab on the Monitor page gives you a bird's-eye view of the Router Health SLE's success rate across different sites of the organization. From this Tab, you can easily view which site or sites impact the overall Router Health SLE score. Administrators can use this page as the starting point to drill down to the unhealthy router or routers impacting the overall Router Health SLE score of a specific site.
To view Router Health SLE at the organization level:
Navigate to Monitor > Service Levels > Routing.
Select Entire Org from the site drop-down list.
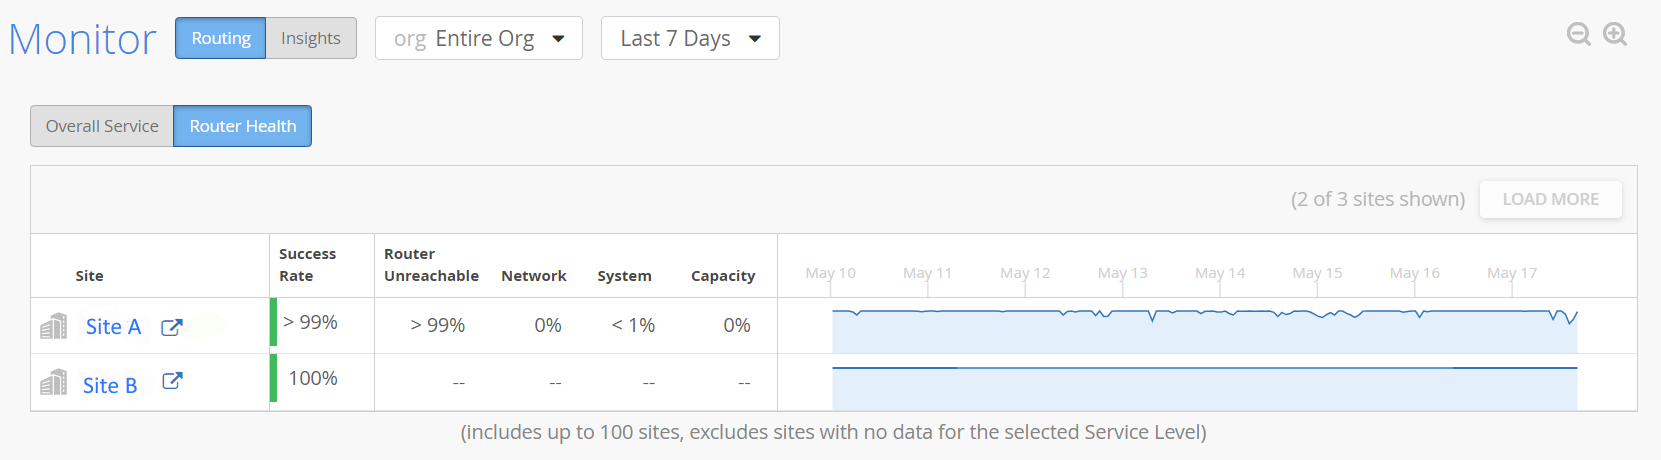
Click Router Health.
From this Tab, you can view the success rate of the SLE, failure rate of all the classifiers of the SLE and, the timeline during which the SLE was impacted. To know more about the classifiers, see Router Health SLE.
In Figure 2, you can see that Site A is impacting the Router Health SLE at an organization level.
View Router Throughput SLE at an Organization Level
The Router Throughput Tab on the Monitor page gives you a bird's-eye view of the Router Throughput SLE's success rate across different sites of the organization. From this Tab, you can easily view which site or sites impact the overall Router Throughput SLE score. Administrators can use this page as the starting point to drill down to the unhealthy router or routers impacting the overall Router Throughput SLE score of a specific site.
To view Router Throughput SLE at the organization level:
Navigate to Monitor > Service Levels > Routing.
Select Entire Org from the site drop-down list.
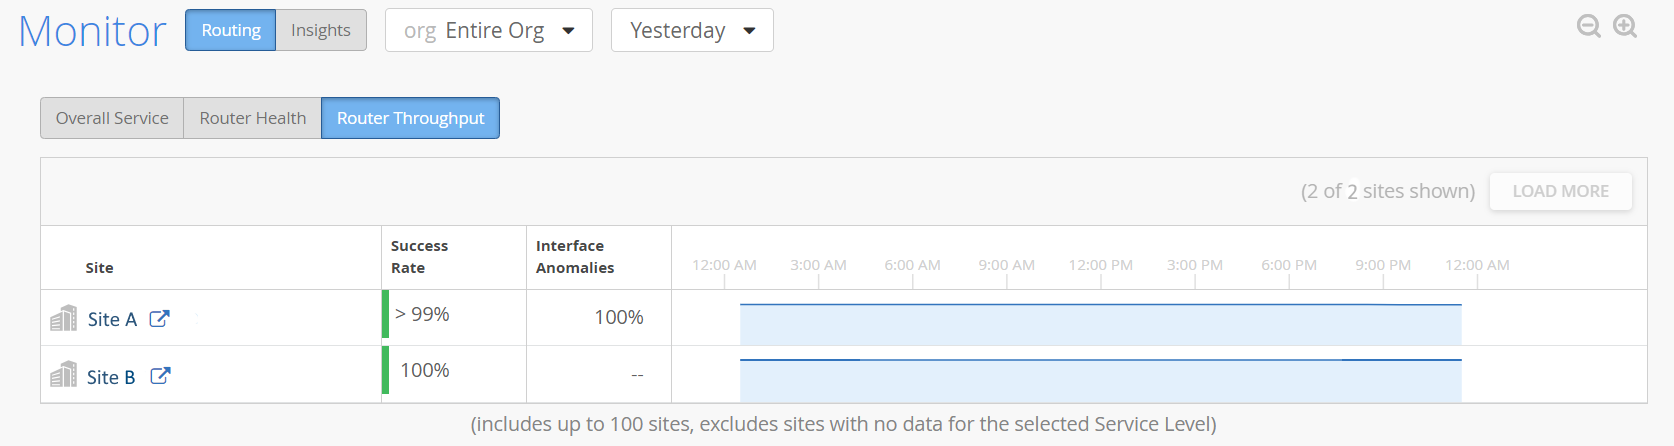
Click Router Throughput.
From this Tab, you can view the success rate of the SLE, failure rate of all the classifiers of the SLE and, the timeline during which the SLE was impacted. To know more about the classifiers, see.
In Figure 3, you can see that Site A is impacting the Router Throughput SLE at an organization level with a success rate more than 99 percent. Interface anomalies contributed to failed Router Throughput 98 percent of the time and Congestion contributed to failed Router Throughput 2 percent of the time.