Router Charts
To access the Router Charts section, navigate to Organization > Inventory > Routers > Router Name > Router Insights or Routers > Router Name > Router Insights.
The Router Charts section on the Monitor page displays various time-series graphs such as CPU Utilization graph and Memory Utilization graph. You can also view the total bytes of data transmitted and received by a router in a given interval.
CPU Utilization and Memory Utilization
The CPU Utilization and Memory Utilization time series graphs display a router's CPU and memory utilization, respectively for a specific period.
You can move the slider across the graph. A pop-up on the slider displays the CPU and memory utilization for that period. As you move the slider along the charts, you can see the slider of the Router Events chart also move, simultaneously.
This feature serves as an indicator to the performance of the router. You can correlate the peaks in the CPU and memory utilization graphs to specific router events that might have occurred during the same interval. You can use this information to investigate the reason for occurrence of these events and remediate actions in case of unexpected events.
Follow the procedure below to understand what is happening in a router when you see a spike in the CPU or memory utilization graphs:
-
Place the slider on a peak in the CPU or Memory Utilization graph.
-
View the Router Events graph to see router events that might have occurred at this instant.
-
Refer to the Router Events chart to know the event type.
For example, a configuration update event would cause the CPU utilization to spike.
From the graphs, you can view the average CPU and memory consumption, the maximum CPU and memory consumption, the date and time intervals at which CPU and memory utilization were the highest.
You can view the graph legend below the chart to interpret the plotted lines.
Click the expand icon for an enlarged view of the graph.
Transmitted and Received Bytes
The Bytes graph displays the volume of data transmitted and received by a router as a function of time. To view the byte count information for a specific port, select the port from the port drop-down list. The Bytes graph displays the volume of data transmitted and received on the selected port during a specific interval. For example, in Figure 1, 9.5 GB is the volume of data transmitted and 17.8 GB is volume of data received between 10:10 AM and 10:20 AM.
Select All Ports to view the transmitted and received byte count across all ports.
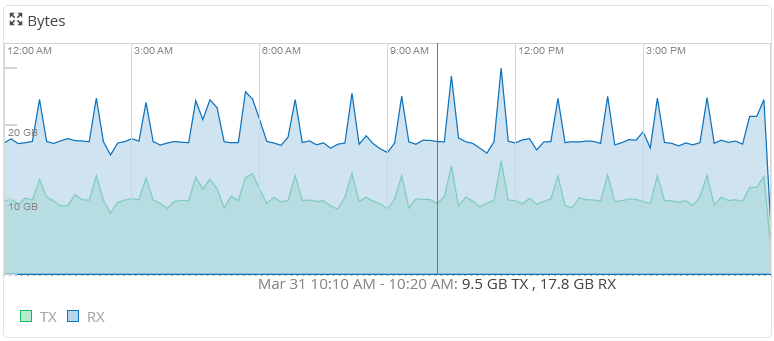
By default, the Transmitted and Received Bytes graph displays the transmitted and received byte count across all ports.
You can move the slider across the graph. As you move the slider along the graph, you can see the slider of the Router Events graph also move simultaneously.
Using this feature, you can visually correlate a router event (from the Router Events graph) to the traffic flow across a router. For example, if you notice a sudden drop in traffic, see the router events graph to investigate router events that might have caused the traffic drop.
You can view the graph legend below the chart to interpret the plotted lines.
Click the expand icon for an enlarged view of the graph.
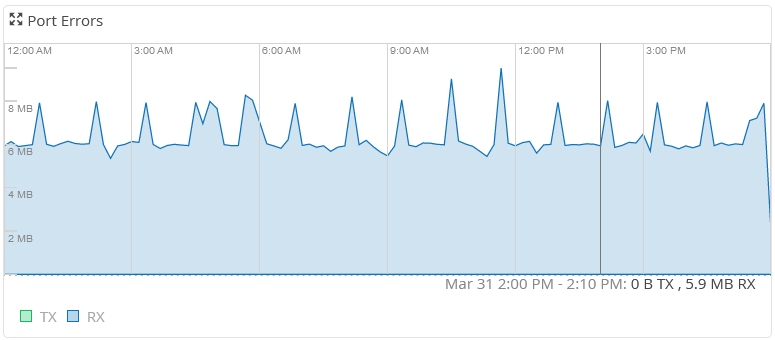
Port Errors
Port Errors graph displays real-time statistics about errors on traffic ports of a router. The peaks in the graph indicate a mismatch in transmit data rate and receive date rate of a router. Port errors account for the erroneous counters which occur at the input and output interface queues of a router. Frame checksum (FCS) errors, L2 channel errors, L2 mismatch timeouts, and resource errors are some of the input port errors. Aged packets, carrier transitions, and maximum transmission unit (MTU) errors are some of the output port errors.
To view port errors, Select a port from the port drop-down list. The graph displays the transmitted and received bytes information for the selected port. You can also view the port errors data for all ports, at once, by selecting All Ports from the port drop-down list.
You can move the slider across the graph. As you move the slider, you can see the slider of the Router Events graph also move simultaneously.
Using this feature, you can visually correlate a router event (from the Router Events graph) to an error on a port. For example, if you notice a port error, see the router events graph to investigate router events that might have caused the error.
By default, the Port Errors graph displays port errors for all traffic ports.
You can view the graph legend below the chart to interpret the plotted lines.
Click the expand icon for an enlarged view of the graph.