Tests and Monitors Overview
Monitoring key performance indicators (KPIs) such as the response time, congestion, and reachability is important to gauge the quality of your network. To evaluate the KPIs, Active Assurance enables you to create and run Test and Monitors to measure common metrics such as delay, delay variance (jitter), packet loss, round-trip response time, and so on.
A Test is a set of verifications that is performed by one or more Test Agents for a finite amount of time. For more information on Tests, see Measuring Metrics Using Active Assurance Tests.
A Monitor is a set of verifications that is performed by one or more Test Agents for an infinite amount of time. For more information on Monitors, see Measuring Metrics Using Active Assurance Monitors.
Both Tests and Monitors entails Tasks. The Task contains the configuration to measure a specific metrics by using certain protocols. For information on the protocols that are supported in Paragon Automation, see Supported Protocols.
When you create and run a Test or Monitor, the Test Agent receives the measurement configuration that you have defined in the Test or Monitor. Based on the protocols that you have defined during the Task creation, the Test Agent downloads the required protocols from Paragon Automation, starts collecting the measurements, and shares the data in the form of streams that you can view in the Paragon Automation GUI. This information helps you to gain insights into your network's health, performance, and quality.
Measuring Metrics Using Active Assurance Tests
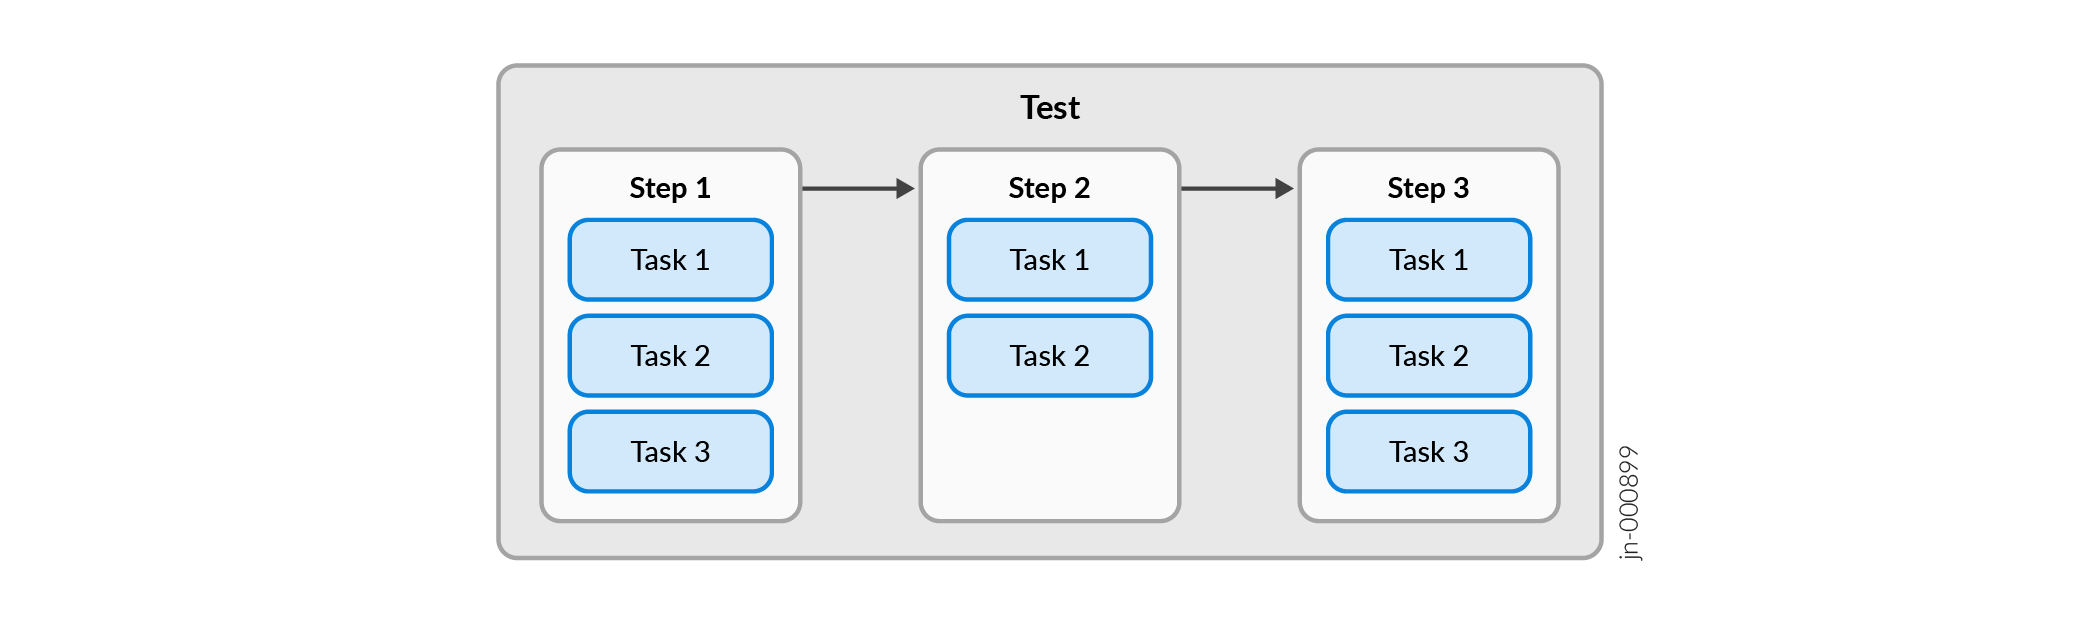
A Test is a set of verifications that are performed by one or more Test Agents for a finite amount of time. A Test contains one or more Steps and Tasks, which validates whether KPIs that are defined in the Tests can be considered as operational (pass) or not (fail).
A Test can consist of several Steps that are executed sequentially. Each Step can consist of one or more Tasks that run concurrently. A Task contain the configuration to measure specific metrics.
Figure 1 illustrates the relation between a Test, Steps, and Tasks in Paragon Automation.
Test measures metrics in a time-bound manner and therefore you need to set the duration for each Step which determines the duration of the entire Test.
A Test delivers a binary result—Pass or Fail.
If any one Task with the Test fails, then Test status is displayed as Fail.
Measuring Metrics Using Active Assurance Monitors
A Monitor is a set of verifications that are performed by one or more Test Agents for an infinite amount of time. A Monitor can contain multiple Tasks, which run in parallel and continuously monitors the KPIs that are defined in the Monitor. A Task contains the configuration to measure specific metrics.
Figure 2 illustrates the relation between a Monitor and Tasks in Paragon Automation.

Monitors measure the metrics indefinitely until you decide to stop the Monitor. There is no limited time duration for which you want to stop a Monitor. Since you can start and stop a Monitor at will you need not set the duration.
A Monitor delivers a time-framed result as it runs continuously.
Supported Protocols
Paragon enables you to configure the protocols listed in Table 1 for a Task.
|
Protocol |
Description |
|---|---|
|
HTTP |
The HTTP Task is used to test or monitor HTTP servers. Running an HTTP Task checks the performance of a website or web application of the web server and of the network between the web server and the Test Agent. You can request web pages and verify response codes from distributed locations inside or outside of your network. When an HTTP Task starts, the Test Agents make an HTTP Get request towards the specified URL and fetch the response. The task does not render HTML pages. Hence, test agents do not make additional requests for linked resources, (images, CSS files, and so forth). Measured parameters include TCP connect time, time until first byte received, time until last byte received, and download speed. This task is applicable for both IPv4 and IPv6. |
|
DNS |
The DNS task is used to test and monitor DNS servers. When a DNS task starts, the test agents send a request to resolve a lookup address, and collect statistics on response times. DNS primarily uses User Datagram Protocol (UDP) on port number 53 to serve requests. DNS queries consist of a single UDP request from the client followed by a single UDP reply from the server. Running a DNS task provides information about the response times of your DNS servers from different locations. High DNS response times translate into high response times for all services that use DNS to resolve IP addresses, such as web surfing. This task is applicable for both IPv4 and IPv6. |
|
Ping |
The ping task initiates a task that checks connectivity to the remote device. Running a ping task provides information about the delay, delay variance (jitter), packet loss of the connection to the remote host. The Ping tool uses Internet Control Message Protocol (ICMP) or UDP to initiate a single request from the test agent to the host, followed by a single response from the host. This task works with both IPv4 and IPv6. |
|
TWAMP/TWAMP Light |
|
|
TWAMP Reflector |
The TWAMP Reflector is a component of TWAMP. It receives test packets from the Session-Initiator and reflects them back. Running a TWAMP Reflector helps in evaluation of the quality of the network and provides information on how data is transmitted in two-directions; between Session-Initiator and Session-Reflector. This bidirectional communication enables the measurement of performance metrics such as round-trip delay, delay variance (jitter), and packet loss. This task is applicable for both IPv4 and IPv6. |
|
RPM HTTP |
Use this task if you are using ACX, PTX or MX device. The RPM HTTP task checks connectivity to the remote device. |
|
RPM ICMP |
Use this task if you are using ACX, PTX or MX device. You can measure one-way measurements for ICMP timestamp probes that includes information on
|
|
RPM TCP |
Use this task if you are using ACX, PTX or MX device.
|
|
RPM TWAMP |
Use this task if you are using ACX, PTX or MX device. The two way active measurement protocol (TWAMP) facilitates the measurement of two-way or round-trip network performance metrics. Running a TWAMP task provides information about the round-trip delay, delay variance (jitter), and packet loss. The Session-Initiator creates TWAMP test packets and sends to the Session-Reflector in the TWAMP server, and the Session-Reflector sends back a measurement packet when a test packet is received. TWAMP uses TWAMP-Control protocol to perform a handshake between initiator and reflector. |
|
RPM UDP |
Use this task if you are using ACX, PTX or MX device. This Test checks if your network is good enough for quality-demanding services such as client–server applications and video conferencing. When a UDP task starts, the Test Agents will generate traffic at the rate you specify. The rate is the Layer 2 Ethernet rate, also known as the Committed Information Rate (CIR). It includes the Ethernet headers with the CRC checksum but not the Frame Gap, Preamble, or Start of Frame Delimiter. The UDP flow sent by the sender Test Agent includes timestamps and sequence numbers, so that the receiving Test Agent can calculate one-way delay, jitter, and packet loss. |
|
Junos RPM Ping |
The Junos Remote Procedure Monitoring (RPM) Ping task checks connectivity from Junos routers (ACX, MX, or PTX) to a remote device. The Junos router acts like a test agent and collect metric measurements. The routers collect measurements by polling using NETCONF CLI commands on Junos that uses Remote Procedure Call (RPM) functionality such as ping. You can use this protocol to collect measurements for round trip time and delay variance (jitter). Before using this protocol, verify that you enabled NETCONF in the Junos routers. The protocol that you choose depends on the destination device (web server or DNS server) and the source (Test Agent or MX device) that initiates a task. For example, you can use Ping or Junos RPM Ping to check connectivity to a remote device. Test Agents initiate a ping task to measure delay and delay variance (jitter), with additional configurations for the packet such as the payload size. However, only Test Agents that run on x86 machines (that support Junos OS Evolved) can successfully complete a Ping task. If you want to check connectivity from a Junos device such as MX or vMX, you must use the Junos RPM Ping task. |
Benefits of Using Active Assurance Tests and Monitors
-
Enables you to analyze reachability, congestion, and response time in networks to support business critical applications.
-
Access historical view of errors in your network.
-
Customize parameters and thresholds to reflect the optimum network performance that you require.