Interfaces Data and Test Results
This topic provides information about the results of the tests that Paragon Automation executes to determine the state of the device interfaces.
Overview
The Interfaces accordion displays the interfaces data and results of the tests that Paragon Automation executes to determine that:
-
The device’s interfaces are up.
-
There are no port flapping issues.
-
The input and output traffic does not exceed the threshold limit.
You can also view events (alerts and alarms), if any, for the device on the Interfaces accordion.
To access the Interfaces accordion, navigate to the Observability > Health > Troubleshoot Devices page. Click a device name to access the Device-Name page. Click the Interfaces (accordion) in the Overview tab.
The top-right corner of the accordion displays the overall health of the interfaces. The various states are:
-
Healthy—The interfaces are healthy.
-
Being Monitored—The health of the interfaces is being monitored.
-
Action Needed—The interfaces have issues that you must address (may not be immediately).
-
Urgent Action Needed—The interfaces have issues that you must address immediately.
Table 1 lists the results of the interface checks.
| Field | Description |
|---|---|
|
Pluggables |
Total number of available pluggables, and the total number of unhealthy pluggables. Click the link next to Pluggables to view:
You can view this information for the past week, day, 3 hours, 1 hour, 30 minutes, or a custom time period. See Pluggables Details for Device-Name Page for more information. |
|
Input Traffic |
Total number of available interfaces, and the total number of unhealthy interfaces. Click the link next to Input Traffic to view:
You can view this information for the past week, day, 3 hours, 1 hour, 30 minutes, or a custom time period. See Input Traffic Details for Device-Name Page for more information. |
|
Output Traffic |
Total number of available interfaces, and the total number of unhealthy interfaces. Click link next to Output Traffic to view:
You can view this information for the past week, day, 3 hours, 1 hour, 30 minutes, or a custom time period. See Output Traffic Details for Device-Name Page for more information. |
|
Interfaces |
Total number of available interfaces, the total number of interfaces that are down. An interface is marked unhealthy when the interface:
Click link next to Interfaces to view details about link state and port flapping issues. You can view this information for the past week, day, 3 hours, 1 hour, 30 minutes, or a custom time period. See Interfaces Details for Device-Name Page for more information. |
|
Relevant Events |
Displays two issues or anomalies with respect to the interfaces in order of severity. Hover over View Details to view more information about an issue in a pop-up. Click View All Relevant Events to view all device interface issues, on the Events for Device-Name page. You can view relevant events for the past seven days. |
Pluggables Details for Device-Name Page
To access the Pluggables Details on the Paragon Automation GUI, click Observability > Health > Troubleshoot Devices > Device-Name > Overview > Interfaces (accordion) > Pluggables data-link.
You can view the health and functioning of the pluggables from the Pluggables Details for Device-Name page.
The three accordions on this page provide information on optical temperature, transmission power, and receiving power. Table 2 describes the accordions.
| Accordion | Description |
|---|---|
|
Optical Temperature |
View the optical temperature for the optical interfaces. You can view up to six interfaces on a graph at a time. These interfaces are listed in the order of severity of the events that have occurred on them. The interface with the most critical events appear at the top of the list. Click the toggle button next to an interface in the Show Interfaces list to view the performance and alerts of the interface in a graph. See Performance Graphs for more information. |
|
Optical Tx Power |
View the outgoing signal strength for the optical interfaces. You can view up to six interfaces on a graph at a time. These interfaces are listed in the order of severity of the events that have occurred on them. The interface with the most critical events appear at the top of the list. Click the toggle button next to an interface in the Show Interfaces list to view the performance and alerts of the interface in a graph. See Performance Graphs for more information. |
|
Optical Rx Power |
View the incoming signal strength for the optical interface. You can view up to six interfaces on a graph at a time. These interfaces are listed in the order of severity of the events that have occurred on them. The interface with the most critical events appear at the top of the list. Click the toggle button next to an interface in the Show Interfaces list to view the performance and alerts of the interface in a graph. See Performance Graphs for more information. |
Performance Graphs
The graphs on the Pluggables Details for Device-Name page display the health and functioning of the pluggables. You can also view information on alerts and breaches, if any, on these graphs. Figure 1 shows details about optical temperature for a device interface on the graph.
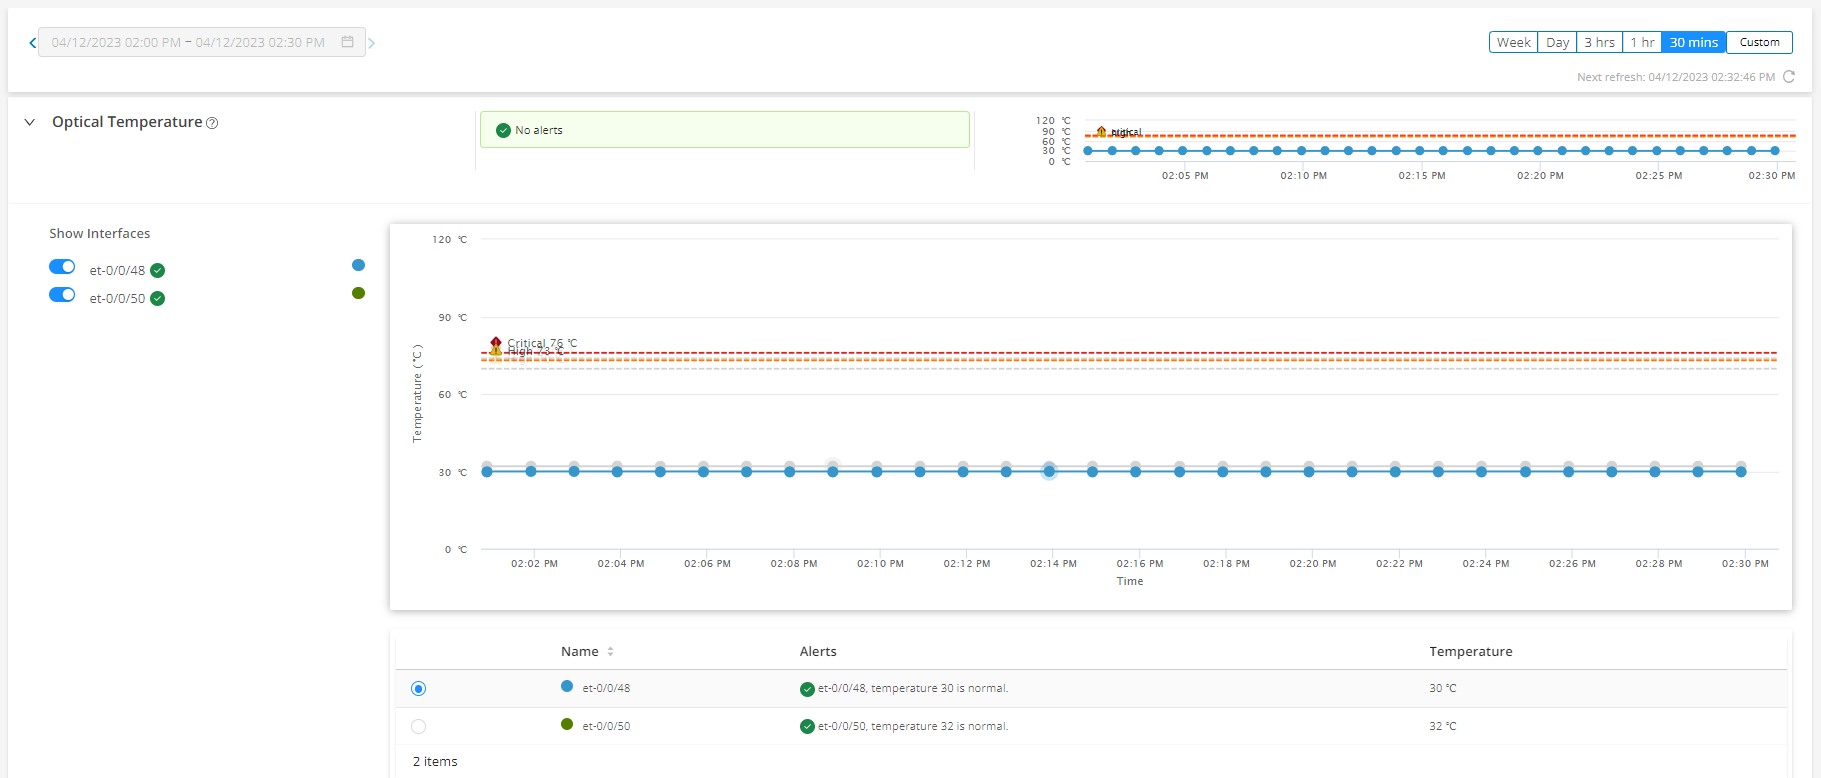
The interfaces present in the device are listed on the left of the Optical Temperature accordion, in the order of severity of events that have occurred on them. You can view up to six interfaces at a time. To view interfaces that are not listed, click the Select Interfaces drop-down list and select the interface. However, you must clear a previously selected interface to be able to select another interface.
Click the toggle button next to the name of the interface to view the performance of that interface in a graph. The graph displays two lines showing the high (in orange) and critical (in red) threshold levels related to the events that have occurred on the interface. Another line on the graph displays the data points related to events that have occurred on the interface. The color of the data points depend on the color of the interface that you have selected. The color of the interface is assigned automatically. Click any data point to view more information about the corresponding event in a pop-up. The cause for the alert, if any, is also displayed.
To view the performance of more than one interface on the graph, click the toggle button next to the name of the interface in the Show Interfaces list. Details of the interfaces displayed on the graph are also listed in a table below the graph as shown in Figure 1. You can also click the option buttons on the left of an interface name in the table to highlight the graph for that interface.
You can view the optical temperature information for a week, a day, 3 hours, 1 hour, 30 minutes, or a custom time period. By default, information for the past 30 minutes is displayed. To change this period, click the Week, Day, 3 hrs, 1 hr, 30 mins, or Custom buttons provided above the graph.
The graph auto-refreshes at an interval depending on the time range for which the information is displayed. See Table 3 for more information. However, you can refresh the graph at any point by clicking the -Refresh icon provided above the graph.
You can also click the pop-out button next to the graph to open the graph in a new tab and view all customizations that you made on the graph in the parent tab, in the new tab.
The most critical alert (issues and anomalies) related to optical temperature is displayed just above the graph and next to the quick chart. To view other alerts, click the link just below the alert. The quick chart displays the performance of the interface that you selected from the Select Interfaces drop-down list. However, if alerts related to the performance of any interface is generated, the interface with the most severe alert is displayed on the quick chart by default.
Alerts, if any, related to optical temperature is displayed on the graph, and in the table below the graph. You can also open the graph in a new tab. When you open a graph in a new tab, you can view the following information in the new tab as well:
-
Alerts related to optical temperature.
Alerts are refreshed across all open tabs simultaneously, when:
-
An alert is refreshed in any one of the open tabs.
-
The last alert fetched was beyond three minutes.
-
-
List of interfaces that you toggled to view from the Select Interfaces drop-down list.
-
Interface that you selected from the table below the graph.
| Time Range | Auto-Refreshed |
|---|---|
| Weekly | Every 16.8 hours |
| Daily | Every 58 minutes |
| Every three hours | Every 8 minutes |
| Hourly | Every 3 minutes |
| Thirty minutes | Every 2 minutes |
| Custom | No auto-refresh |
You can similarly view the graphs and alerts related to strength of the outgoing signal (Optical Tx Power), and strength of the incoming signal (Optical Rx Power).
Input Traffic Details for Device-Name Page
To access the Input Traffic Details on the Paragon Automation GUI, click Observability > Health > Troubleshoot Devices > Device-Name > Overview > Interfaces (accordion) > Input Traffic data-link.
You can view information about input traffic flow on the Input Traffic Details for Device-Name page.
The eight accordions on this page provide information about signal functionality, the highest and lowest power of the incoming signal, receiving (Rx) power, input traffic range, input errors, CRC errors, and FEC Corrected and Uncorrected Errors.
Table 4 describes the accordions.
| Accordion | Description |
|---|---|
|
Signal Functionality |
View signal functionality (receiving [Rx] signal loss) at the device’s interfaces. You can view data for up to six interfaces on a graph at a time. These interfaces are listed in the order of severity of the events that have occurred on them. The interface with the most critical events appear at the top of the list. Click the toggle button next to an interface in the Rx Loss Of Signal Alarm list to view the performance and alerts of the interface in a graph. See Performance Graphs for more information. |
|
Optical Rx Power |
View optical power of the incoming signal (Rx power) at the device’s interfaces. You can view data for up to six interfaces on a graph at a time. These interfaces are listed in the order of severity of the events that have occurred on them. The interface with the most critical events appear at the top of the list. Click the toggle button next to an interface in the Show Interfaces list to view the performance and alerts of the interface in a graph. See Performance Graphs for more information. |
|
Input Traffic |
View input traffic at the device’s interfaces. You can view data for up to six interfaces on a graph at a time. These interfaces are listed in the order of severity of the events that have occurred on them. The interface with the most critical events appear at the top of the list. Click the toggle button next to an interface in the Show Input Traffic list to view the performance and alerts of the interface in a graph. See Performance Graphs for more information. |
|
Input Errors |
View input errors generated at the device’s interfaces. You can view data for up to six interfaces on a graph at a time. These interfaces are listed in the order of severity of the events that have occurred on them. The interface with the most critical events appear at the top of the list. Click the toggle button next to an interface in the Show Input Errors list to view the performance and alerts of the interface in a graph. See Performance Graphs for more information. |
|
FEC Corrected Errors |
View forward error correction (FEC) corrected errors generated at the device’s interfaces. You can view data for up to six interfaces on a graph at a time. These interfaces are listed in the order of severity of the events that have occurred on them. The interface with the most critical events appear at the top of the list. Note:
FEC corrected errors are available on interfaces that support speeds equal to or greater than 100-Gbps. Click the toggle button next to an interface in the Show Interfaces list to view the performance and alerts of the interface in a graph. See Performance Graphs for more information. |
|
FEC Uncorrected Errors |
View forward error correction (FEC) uncorrected errors generated at the device’s interfaces. You can view data for up to six interfaces on a graph at a time. These interfaces are listed in the order of severity of the events that have occurred on them. The interface with the most critical events appear at the top of the list. Note:
FEC uncorrected errors are available on interfaces that support speeds equal to or greater than 100-Gbps. Click the toggle button next to an interface in the Show Interfaces list to view the performance and alerts of the interface in a graph. See Performance Graphs for more information. |
|
CRC Errors |
View cyclic redundancy check (CRC) errors generated at the device’s interfaces. You can view data for up to six interfaces on a graph at a time. These interfaces are listed in the order of severity of the events that have occurred on them. The interface with the most critical events appear at the top of the list. Click the toggle button next to an interface in the Show CRC Errors list to view the performance and alerts of the interface in a graph. See Performance Graphs for more information. |
|
Framing Errors |
View framing errors generated at the device’s interfaces. You can view data for up to six interfaces on a graph at a time. These interfaces are listed in the order of severity of the events that have occurred on them. The interface with the most critical events appear at the top of the list. Click the toggle button next to an interface in the Show Interfaces list to view the performance and alerts of the interface in a graph. See Performance Graphs for more information. |
Performance Graphs
The graphs on the Input Traffic Details for Device-Name page display detailed information about input traffic flow. You can also view information about alerts and breaches, if any, on these graphs.
To view information related to input traffic on a graph, navigate to Observability > Health > Troubleshoot Devices > Device-Name > Overview > Interfaces (accordion) > Input Traffic data-link , and click any accordion. Detailed information and graphs related to that accordion are displayed within that input traffic accordion.
Figure 2 shows details about input traffic flow for a device interface on the graph.
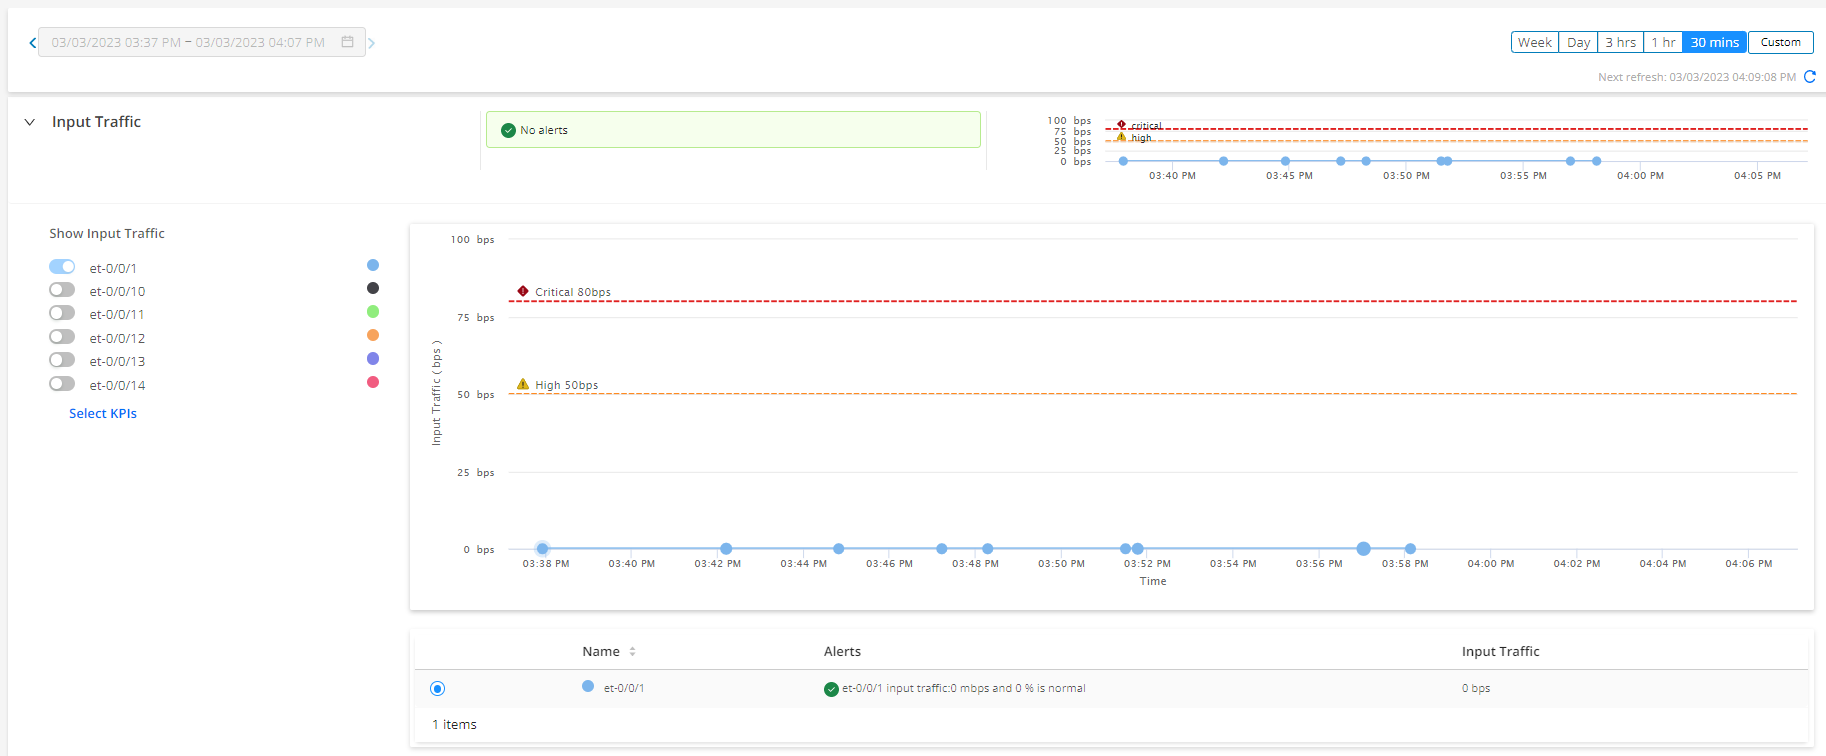
The interfaces present in the device are listed on the left of the Input Traffic accordion, in the order of severity of events that have occurred on them. You can view up to six interfaces at a time. To view interfaces that are not listed, click the Select Interfaces drop-down list and select the interface. However, you must clear a previously selected interface to be able to select another interface.
Click the toggle button next to the name of the interface, to view details on input traffic flow of that interface in a graph. The graph displays two lines showing the high (in orange) and critical (in red) threshold levels related to the events that have occurred on the interface. Another line on the graph displays the data points related to events that have occurred on the interface. The color of the data points depend on the color of the interface that you have selected. The color of the interface is assigned automatically. Click any data point to view more information about the corresponding event in a pop-up. The cause for the alert, if any, is also displayed.
To view the performance of more than one interface on the graph, click the toggle button next to the name of the interface in the Show Input Traffic list. Details of the interfaces displayed on the graph are also listed in a table below the graph as shown in Figure 2. You can also click the option buttons on the left of an interface name in the table to highlight the graph for that interface.
You can view information related to input traffic for a week, a day, 3 hours, 1 hour, 30 minutes, or a custom time period. By default, information for the past 30 minutes is displayed. To change this period, click the Week, Day, 3 hrs, 1 hr, 30 mins, or Custom buttons provided above the graph.
The graph auto-refreshes at an interval depending on the time range for which the information is displayed. See Table 5 for more information. However, you can also choose to refresh the graph at any point by clicking the Refresh icon provided above the graph.
You can also click the pop-out button next to the graph to open the graph in a new tab and view all customizations that you made on the graph in the parent tab, in the new tab.
The most critical alert (issues and anomalies) related to input traffic is displayed just above the graph and next to the quick chart. To view other alerts, click the link just below the alert. The quick chart displays the performance of the interface that you selected from the Select Interfaces drop-down list. However, if alerts related to the performance of any interface is generated, the interface with the most severe alert is displayed on the quick chart by default.
Alerts, if any, on events related to input traffic that have occurred are displayed on the graph, and in the table below the graph. You can also open the graph in a new tab. When you open a graph in a new tab, you can view the following information in the new tab as well:
-
Alerts related to input traffic.
Alerts are refreshed across all open tabs simultaneously, when:
-
An alert is refreshed in any one of the open tabs.
-
The last alert fetched was beyond three minutes.
-
-
List of interfaces that you toggled to view from the Select Interfaces drop-down list.
-
Interface that you selected from the table below the graph.
| Time Range | Auto-Refreshed |
|---|---|
| Weekly | Every 16.8 hours |
| Daily | Every 58 minutes |
| Every three hours | Every 8 minutes |
| Hourly | Every 3 minutes |
| Thirty minutes | Every 2 minutes |
| Custom | No auto-refresh |
You can similarly view the graphs and alerts related to signal functionality, the highest and lowest power of the incoming signal, receiving (Rx) power, input errors, and CRC errors.
Output Traffic Details for Device-Name Page
To access the Output Traffic Details on the Paragon Automation GUI, click Observability > Health > Troubleshoot Devices > Device-Name > Overview > Interfaces (accordion) > Output Traffic data-link.
You can view detailed information about output traffic flow from the Output Traffic Details for Device-Name page.
The seven accordions on this page provide information about signal functionality, the highest and lowest power of the outgoing signal, transmission (Tx) power, output traffic range, output errors, and CRC errors.
Table 6 describes the accordions.
| Accordion | Description |
|---|---|
|
Signal Functionality |
View signal functionality (transmission [Tx] signal loss, and Tx laser disabled alarm) at the device’s interfaces. You can view data for up to six interfaces on a graph at a time. These interfaces are listed in the order of severity of the events that have occurred on them. The interface with the most critical events appear at the top of the list. Click the toggle button next to an interface in the Show Signal Functionality list to view the performance and alerts of the interface in a graph. See Performance Graphs for more information. |
|
Optical Tx Power |
View the power of the outgoing signal (Tx power) at the device’s interfaces. You can view data for up to six interfaces on a graph at a time. These interfaces are listed in the order of severity of the events that have occurred on them. The interface with the most critical events appear at the top of the list. Click the toggle button next to an interface in the Show Interfaces list to view the performance and alerts of the interface in a graph. See Performance Graphs for more information. |
|
Output Traffic |
View the output traffic at the device’s interfaces. You can view data for up to six interfaces on a graph at a time. These interfaces are listed in the order of severity of the events that have occurred on them. The interface with the most critical events appear at the top of the list. Click the toggle button next to an interface in the Show Interfaces list to view the performance and alerts of the interface in a graph. See Performance Graphs for more information. |
|
Output Errors |
View the output errors generated at the device’s interfaces. You can view data for up to six interfaces on a graph at a time. These interfaces are listed in the order of severity of the events that have occurred on them. The interface with the most critical events appear at the top of the list. Click the toggle button next to an interface in the Show Interfaces list to view the performance and alerts of the interface in a graph. See Performance Graphs for more information. |
|
FEC Corrected Errors |
View the forward error correction (FEC) corrected errors generated at the device’s interfaces. You can view data for up to six interfaces on a graph at a time. These interfaces are listed in the order of severity of the events that have occurred on them. The interface with the most critical events appear at the top of the list. Note:
FEC corrected errors are available on interfaces that support speeds equal to or greater than 100-Gbps. Click the toggle button next to an interface in the Show Interfaces list to view the performance and alerts of the interface in a graph. See Performance Graphs for more information. |
|
FEC Uncorrected Errors |
View the forward error correction (FEC) uncorrected errors generated at the device’s interfaces. You can view data for up to six interfaces on a graph at a time. These interfaces are listed in the order of severity of the events that have occurred on them. The interface with the most critical events appear at the top of the list. Note:
FEC uncorrected errors are available on interfaces that support speeds equal to or greater than 100-Gbps. Click the toggle button next to an interface in the Show Interfaces list to view the performance and alerts of the interface in a graph. See Performance Graphs for more information. |
|
Output CRC Errors |
View the cyclic redundancy check (CRC) errors at the device’s interfaces. You can view data for up to six interfaces on a graph at a time. These interfaces are listed in the order of severity of the events that have occurred on them. The interface with the most critical events appear at the top of the list. Click the toggle button next to an interface in the Show Interfaces list to view the performance and alerts of the interface in a graph. See Performance Graphs for more information. |
Performance Graphs
The graphs on the Output Traffic Details for Device-Name page display detailed information about output traffic flow. You can also view information about alerts and breaches, if any, on these graphs.
Figure 3 shows details about output traffic flow for a device interface on the graph..
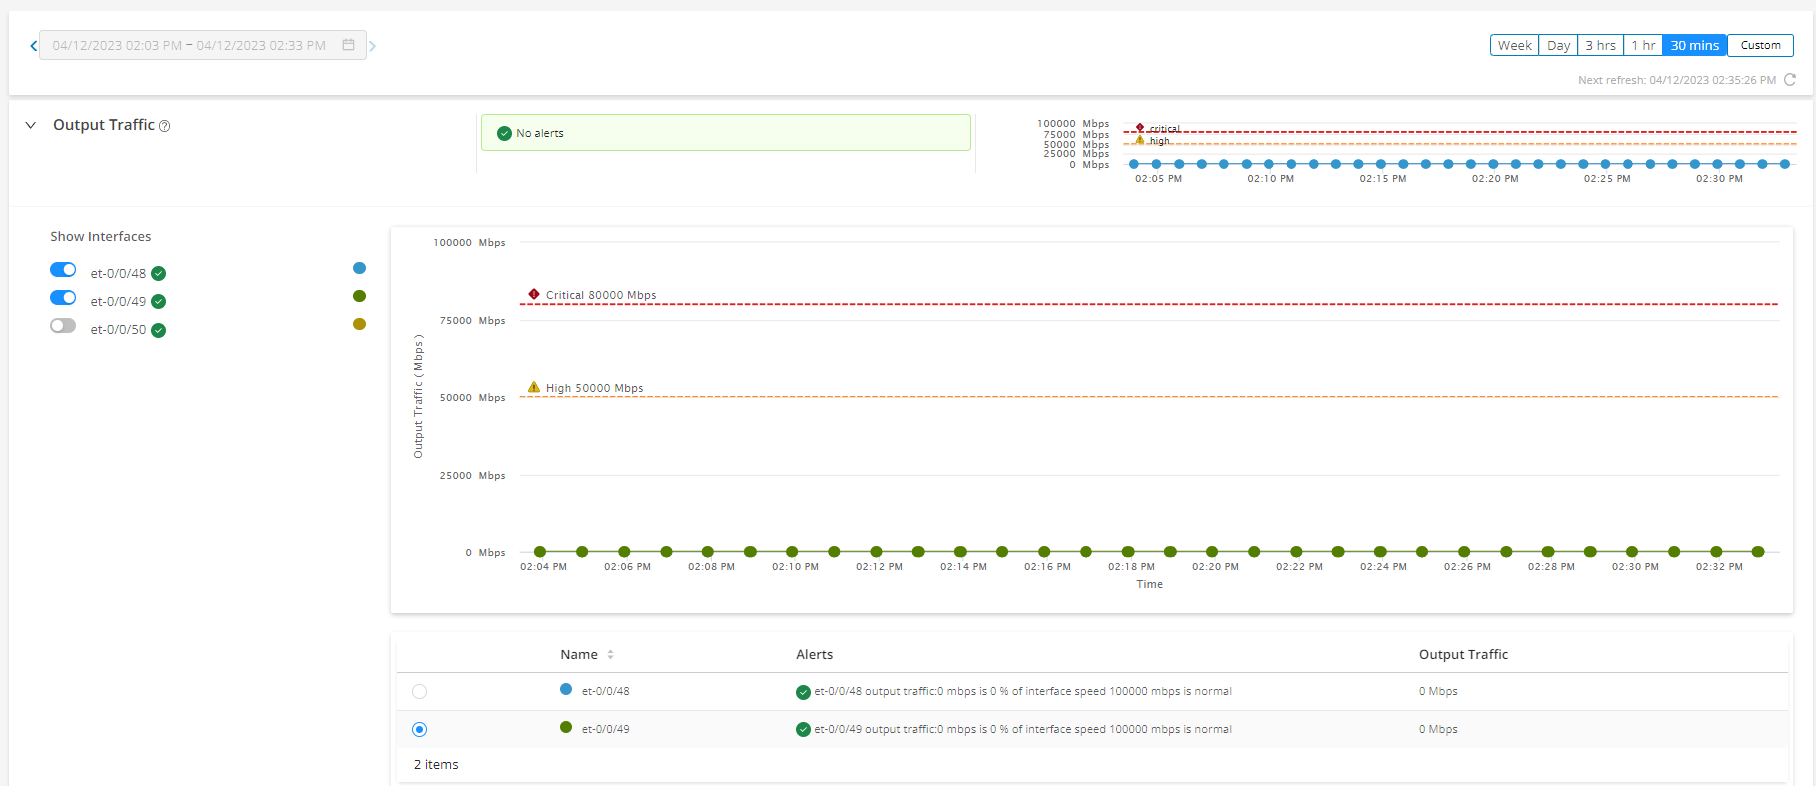
The interfaces present in the device are listed on the left of the Output Traffic accordion, in the order of severity of events that have occurred on them. You can view up to six interfaces at a time. To view interfaces that are not listed, click the Select Interfaces drop-down list and select the interface. However, you must clear a previously selected interface to be able to select another interface.
Click the toggle button next to the name of the interface, to view details on output traffic flow of that interface in a graph. The graph displays two lines showing the high (in orange) and critical (in red) threshold levels related to the events that have occurred on the interface. Another line on the graph displays the data points related to events that have occurred on the interface. The color of the data points depend on the color of the interface that you have selected. The color of the interface is assigned automatically. Click any data point to view more information about the corresponding event in a pop-up. The cause for the alert, if any, is also displayed.
To view the performance of more than one interface on the graph, click the toggle button next to the name of the interface in the Show Interfaces list. Details of the interfaces displayed on the graph are also listed in a table below the graph as shown in Figure 3. You can also click the option buttons on the left of an interface name in the table to highlight the graph for that interface.
You can view information related to output traffic for a week, a day, 3 hours, 1 hour, 30 minutes, or a custom time period. By default, information for the past 30 minutes is displayed. To change this period, click the Week, Day, 3 hrs, 1 hr, 30 mins, or Custom buttons provided above the graph.
The graph auto-refreshes at an interval depending on the time range for which the information is displayed. See Table 7 for more information. However, you can refresh the graph at any point by clicking the Refresh icon provided above the graph.
You can also click the pop-out button next to the graph to open the graph in a new tab and view all customizations that you made on the graph in the parent tab, in the new tab.
The most critical alert (issues and anomalies) related to output traffic is displayed just above the graph and next to the quick chart. To view other alerts, click the link just below the alert. The quick chart displays the performance of the interface that you selected from the Select Interfaces drop-down list. However, if alerts related to the performance of any interface is generated, the interface with the most severe alert is displayed on the quick chart by default.
Alerts, if any, on events related to output traffic that have occurred are displayed on the graph, and in the table below the graph. You can also open the graph in a new tab. When you open a graph in a new tab, you can view the following information in the new tab as well:
-
Alerts related to output traffic.
Alerts are refreshed across all open tabs simultaneously, when:
-
An alert is refreshed in any one of the open tabs.
-
The last alert fetched was beyond three minutes.
-
-
List of interfaces that you toggled to view from the Select Interfaces drop-down list.
-
Interface that you selected from the table below the graph.
| Time Range | Auto-Refreshed |
|---|---|
| Weekly | Every 16.8 hours |
| Daily | Every 58 minutes |
| Every three hours | Every 8 minutes |
| Hourly | Every 3 minutes |
| Thirty minutes | Every 2 minutes |
| Custom | No auto-refresh |
You can similarly view the graphs and alerts related to signal functionality, the highest and lowest power of the outgoing signal, transmission (Tx) power, output errors, and output CRC errors.
Interfaces Details for Device-Name Page
To access the Interfaces Details on the Paragon Automation GUI, click Observability > Health > Troubleshoot Devices > Device-Name > Overview > Interfaces (accordion) > Interfaces data-link.
You can view detailed information about link state performance and issues, and port flapping issues related to physical interfaces from the Interfaces Details for Device-Name page.
The two accordions on this page provide information about link state and port flapping issues related to physical interfaces.
Table 8 describes the accordions.
| Accordion | Description |
|---|---|
|
Link State |
View link state issues present at the device’s interfaces. You can view up to six interfaces on a graph at a time. The interface with the most critical events appear at the top of the list. Click the toggle button next to an interface in the Show Link State list to view the performance and alerts of the interface in a graph. See Performance Graphs for more information. |
|
Link Flap |
View information related to link flapping issues at the device’s interfaces. You can view up to six interfaces on a graph at a time. The interface with the most critical events appear at the top of the list. Click the toggle button next to an interface in the Show Link Flaps list to view the performance and alerts of the interface in a graph. See Performance Graphs for more information. |
Performance Graphs
The graphs on Interfaces Details for Device-Name page display information about link state and port flapping issues related to physical interfaces. You can also view information about alerts and breaches, if any, on these graphs.
Figure 4 shows details about link state performance and issues for an interface on the graph.
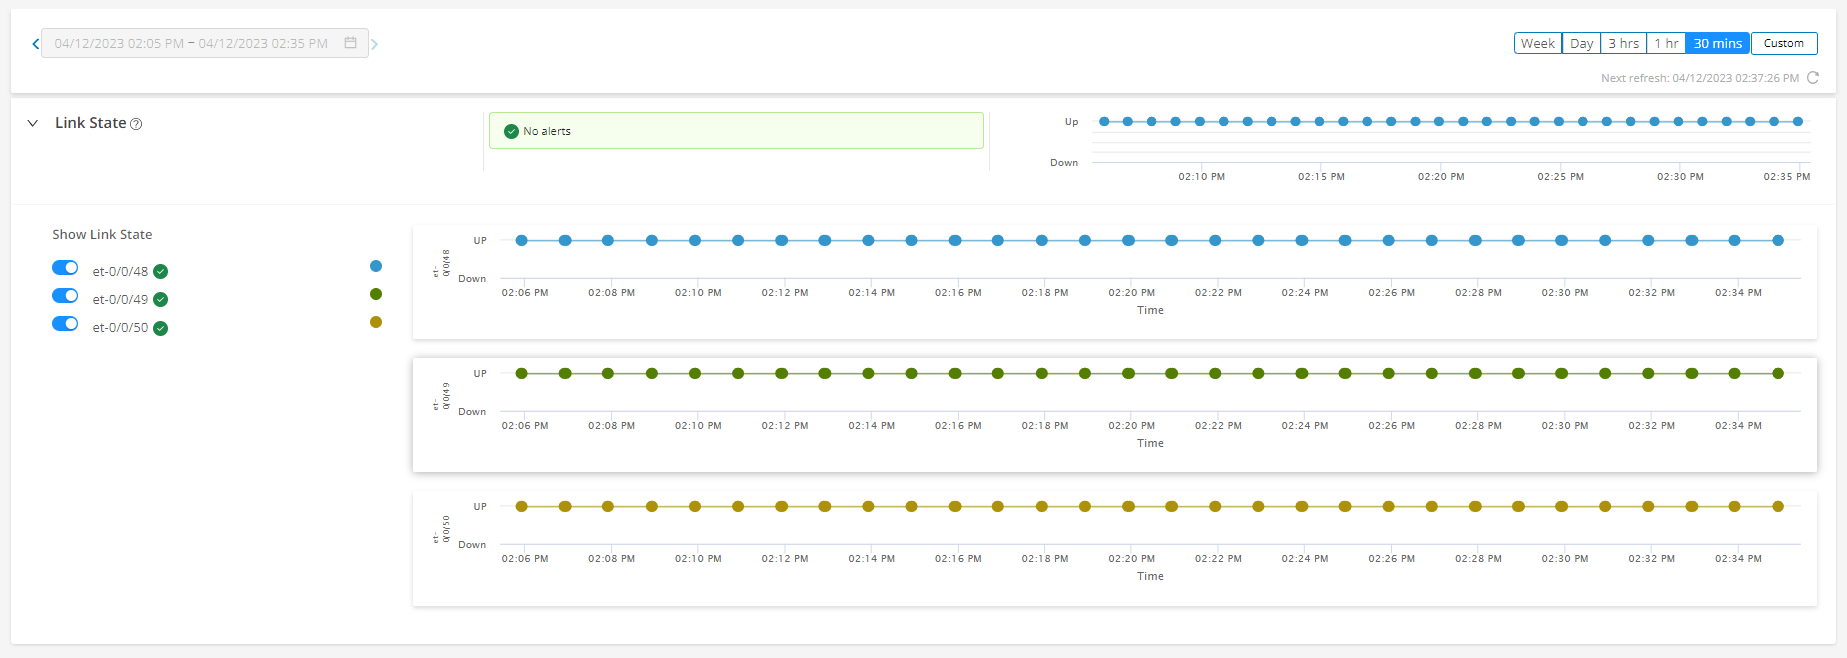
The interfaces for the Link State accordion are listed on the left of the accordion, in the order of severity of events that have occurred on them. You can view up to six interfaces at a time. To view interfaces that are not listed, click the Select Interfaces drop-down list and select the interface. However, you must clear a previously selected interface to be able to select another interface.
Click the toggle button next to the name of the interface, to view details on link state performance and issues for that interface on a graph. The graph displays two lines showing the high (in orange) and critical (in red) threshold levels related to events that have occurred on the interface. Another line on the graph displays the data points related to events that have occurred on the interface. The color of the data points depend on the color of the interface that you have selected. The color of the interface is assigned automatically. Click any data point to view more information about the corresponding event in a pop-up. The cause for the alert, if any, is also displayed.
To view link state performance and issues for more than one interface on the graph, click the toggle button next to the name of the interface in the Show Link State list. The graphs for the interfaces are displayed one after the other.
You can view link state performance for a week, a day, 3 hours, 1 hour, 30 minutes, or a custom time period. By default, information for the past 30 minutes is displayed. To change this period, click the Week, Day, 3 hrs, 1 hr, 30 mins, or Custom buttons provided above the graph.
The graph auto-refreshes at an interval depending on the time range for which the information is displayed. See Table 9 for more information. However, you can refresh the graph at any point by clicking the Refresh icon provided above the graph.
You can also click the pop-out button next to the graph to open the graph in a new tab and view all customizations that you made on the graph in the parent tab, in the new tab.
The most critical alert (issues and anomalies) related to link state performance is displayed just above the graph and next to the quick chart. To view other alerts, click the link just below the alert. The quick chart displays the link state performance and issues related to the interface that you selected from the Select Interfaces drop-down list. However, if alerts related to any interface is generated, the interface with the most severe alert is displayed on the quick chart by default.
Alerts, if any, related to link state performance and issues that have occurred are displayed on the graph. You can also open the graph in a new tab. When you open a graph in a new tab, you can view the following information in the new tab as well:
-
Alerts related to link state performance.
Alerts are refreshed across all open tabs simultaneously, when:
-
An alert is refreshed in any one of the open tabs.
-
The last alert fetched was beyond three minutes.
-
-
List of interfaces that you toggled to view from the Select Interfaces drop-down list.
| Time Range | Auto-Refreshed |
|---|---|
| Weekly | Every 16.8 hours |
| Daily | Every 58 minutes |
| Every three hours | Every 8 minutes |
| Hourly | Every 3 minutes |
| Thirty minutes | Every 2 minutes |
| Custom | No auto-refresh |
You can similarly view the graphs and alerts related to port flapping issues.