Workspace Statistics Page Overview
Use the task tree on the left side of the page to navigate application workspaces and perform tasks within a workspace. When you select an application from the Applications list (at the top left of the Junos Space UI), all the workspaces for the selected application are displayed in the task tree.
If you know the workspace in which you want to perform an action (task), select the workspace from the task tree on the left side of the page. The right side of the page displays information about the selected workspace and its objects.
Workspace Statistics
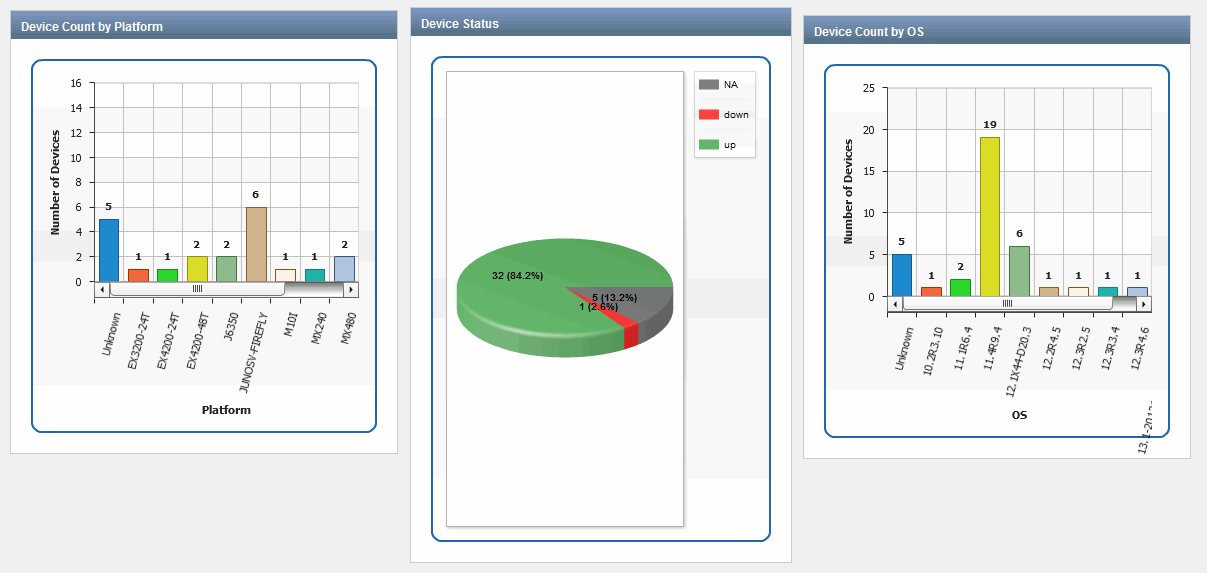
When you select the name of a workspace from the task tree, Junos Space Network Management Platform displays high-level statistics representing the status of managed objects in that workspace. The statistics and charts displayed for different workspaces are different. Figure 1 shows the charts displayed on the Devices workspace statistics page.

If a chart has more data points than can be viewed clearly simultaneously, a scroll bar appears at the bottom or side of the chart.
If you click a bar or pie-chart segment, you navigate to the corresponding inventory page, filtered according to the bar or segment you selected. For example, if you click the MX240 devices bar on the Device Count by Platform bar chart, you navigate to the Devices > Device Management inventory page, which in this case displays all the MX240 devices on the network that are discovered and managed by Junos Space Network Management Platform.
You can move the charts and graphs on the page or resize them.
You can also print or save the statistics by right-clicking the graphic (bar chart or pie chart) and selecting the appropriate option.
