- play_arrow Overview
- play_arrow Operation, Administration, and Management Features
- play_arrow Ethernet OAM and Connectivity Fault Management for Routers
- Introduction to OAM Connectivity Fault Management (CFM)
- Configure Connectivity Fault Management (CFM)
- CFM Action Profile
- Ethernet Local Management Interface
- CFM Support for CCC Encapsulated Packets
- Configure Unified ISSU for 802.1ag CFM
- CFM Monitoring between CE and PE Devices
- Configure Continuity Check Messages
- Example: Configure Ethernet CFM on Physical Interfaces
- Example: Configure Ethernet CFM on Bridge Connections
- Example: Configure Ethernet CFM over VPLS
- play_arrow Link Fault Management for Routers
- play_arrow Ethernet OAM Link Fault Management for Switches
- play_arrow Ethernet OAM Connectivity Fault Management for Switches
- play_arrow Ethernet Frame Delay
- Ethernet Frame Delay Measurements on Switches
- Configure MEP Interfaces on Switches to Support Ethernet Frame Delay Measurements (CLI Procedure)
- Configure One-Way Ethernet Frame Delay Measurements on Switches (CLI Procedure)
- Configure an Iterator Profile on a Switch (CLI Procedure)
- Trigger an Ethernet Frame Delay Measurement Session on a Switch
- Configure Two-Way Ethernet Frame Delay Measurements on Switches (CLI Procedure)
- play_arrow Ethernet Service OAM (ITU-TY.1731) for Routers
- ITU-T Y.1731 Ethernet Service OAM Overview
- Configure Ethernet Frame Delay Measurement Sessions
- Configuring MEP Interfaces to Support Ethernet Frame Delay Measurements
- Configure Ethernet Frame Loss Measurement
- Configure an Iterator Profile
- Configure Ethernet Synthetic Loss Measurements
- Ethernet Alarm Indication
- Inline Transmission Mode
-
- play_arrow Network Monitoring by using SNMP
- SNMP Architecture and SNMP MIBs Overview
- Understand SNMP Implementation in Junos OS
- Configure SNMP in Junos OS
- Configure Options on Managed Devices for Better SNMP Response Time
- Enterprise Specific Utility MIB to Enhance SNMP Coverage
- Optimize the Network Management System Configuration for the Best Results
- Interfaces to Accept SNMP Requests
- Configure SNMP for Routing Instances
- Configure SNMP Remote Operations
- SNMP Traps
- SNMP Traps Supported by Junos OS
- Trace SNMP Activity
- Access Privileges for an SNMP Group
- Configure Local Engine ID on SNMPv3
- Configure SNMPv3
- Configure SNMPv3 Authentication Type and Encryption Type
- SNMPv3 Traps
- SNMPv3 Informs
- SNMP Communities
- MIB Views
- SNMP MIBs Supported by Junos OS and Junos OS Evolved
- Junos OS SNMP FAQs
- play_arrow Remote Network Monitoring (RMON) with SNMP Alarms and Events
- play_arrow Accounting Options
- play_arrow Monitoring Common Security Features
- play_arrow Performance Management
- play_arrow Port Mirroring
- play_arrow Port Mirroring and Analyzers
- Port Mirroring and Analyzers
- Configuring Port Mirroring and Analyzers
- Configuring Port Mirroring Instances
- Configuring Port Mirroring on Physical Interfaces
- Configuring Port Mirroring on Logical Interfaces
- Configuring Port Mirroring for Multiple Destinations
- Configuring Port Mirroring for Remote Destinations
- Configuring Port Mirroring Local and Remote Analysis
- 1:N Port Mirroring to Multiple Destinations on Switches
- Example: Configure Port Mirroring with Family any and a Firewall Filter
- Monitoring Port Mirroring
- Configure Packet Mirroring with Layer 2 Headers for Layer 3 Forwarded Traffic
- Troubleshooting Port Mirroring
-
- play_arrow System Log Messages
- play_arrow Network Management and Troubleshooting
- Compressing Troubleshooting Logs from /var/logs to Send to Juniper Networks Technical Support
- Monitoring and Troubleshooting
- Troubleshooting System Performance with Resource Monitoring Methodology
- Configuring Data Path Debugging and Trace Options
- Using MPLS to Diagnose LSPs, VPNs, and Layer 2 Circuits
- Using Packet Capture to Analyze Network Traffic
- On-Box Packet Sniffer Overview
- Troubleshooting Security Devices
- play_arrow Configuration Statements and Operational Commands
Example: Configure sFlow for EVPN-VXLAN Networks
Use this example to configure and use sFlow monitoring for EVPN-VXLAN traffic with an IPv4 underlay on QFX10000 line of switches.
Requirements
This example uses the following hardware and software components:
- A QFX10002-60C, QFX10002, QFX10008, or QFX10016 switch.
- Junos OS Release 21.3R1, 21.2R2 and later.
This example assumes that you already have an EVPN-VXLAN with an IPv4 underlay based network and want to enable sFlow monitoring on a QFX10000 switch.
Overview and Topology
In this example, you enable sFlow inspection for an existing and working EVPN-VXLAN network traffic with IPv4 underlay.
Topology
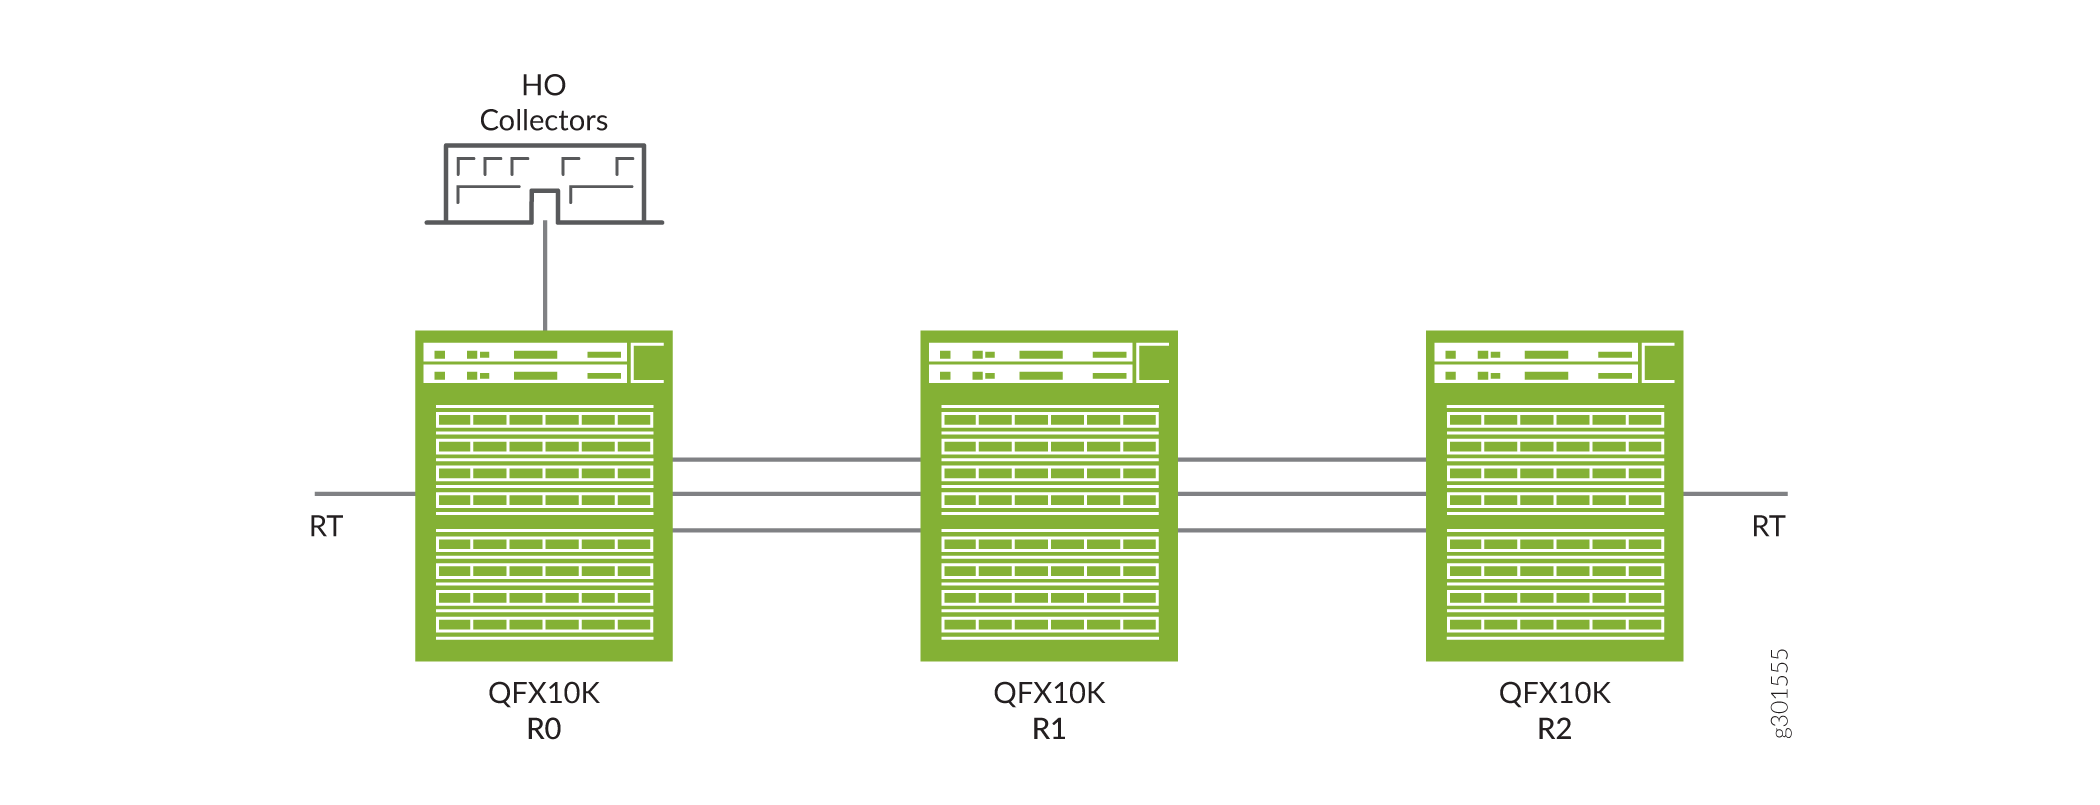
Figure 1 depicts the sFlow support in an EVPN-VXLAN network environment with an IPv4 underlay. In this topology, the sFlow agent performs packet sampling and gathers interface statistics, and then combines the information into UDP datagrams that are sent to sFlow collectors. You can connect an sFlow collector to the switch through the management network or data network. The sFlow program on the switch looks up the next-hop address for the specified collector IP address to determine whether the collector is reachable by way of the management network or data network.
You should configure sFlow on the physical port of your hardware switch and logical interface where the VTEPs (virtual port) are configured and not on VTEPs itself. When you configure sFlow on fabric facing interface, the underlay traffic along with VXLAN traffic is sampled. You can configure sFlow on any of the R0, R1, or R2 devices mentioned in the topology.
For information about basic EVPN-VXLAN underaly configuration, refer to Example: Configuring a QFX10000 Switch as a Layer 3 VXLAN Gateway in an EVPN-VXLAN Centrally-Routed Bridging Overlay.
Configuration
Use the following steps to configure sFlow technology on your QFX10000 switch with EVPN-VXLAN network:
CLI Quick Configuration
To quickly configure this example on your QFX10000 switch, copy the following commands, paste them into a text file, remove any line breaks, change any details necessary to match your network configuration, and then copy and paste the commands into the CLI at the [edit] hierarchy level.
[edit protocols sflow] set polling-interval 20 set sample-rate ingress 10 set source-ip 10.1.12.0 set collector 10.102.70.200set interfaces et-0/0/1.1 sample-rate ingress 100 egress 100
Step-by-Step Procedure
To configure sFlow technology:
Specify in seconds how often the sFlow agent polls the interface:
content_copy zoom_out_map[edit protocols sflow] user@switch# set polling-interval 0
Specify the rate at which ingress packets must be sampled:
content_copy zoom_out_map[edit protocols sflow] user@switch# set sample-rate ingress 100
Configure the source IP address:
content_copy zoom_out_map[edit protocols sflow] user@switch# set source-ip 10.1.12.0
Configure the IP address of the collector:
content_copy zoom_out_map[edit protocols sflow] user@switch# set collector 192.168.200.100
Enable sFlow technology on a specific interface:
content_copy zoom_out_map[edit protocols sflow] user@switch# set interfaces et-0/0/1.1 sample rate ingress 100 egress 100
Commit the configuration:
content_copy zoom_out_map[edit protocols sflow] user@switch# commit
Results
Check the results of the configuration:
[edit]
user@switch# show protocols sflow
agent-id 10.1.12.0/24;
polling-interval 0;
sample-rate {
ingress 16000;
egress 16000;
}
collector 192.168.200.100;
interfaces et-0/0/54.1 {
sample-rate {
ingress 100;
egress 100;
}
}
interfaces et-0/0/56.0;
interfaces et-0/0/57.1 {
sample-rate {
ingress 100;
egress 100;
}
}
Verification
To confirm that the sFlow configuration is enabled and correct.
Verify Configured sFlow Technology
Purpose
Verify the sFlow monitoring is enabled for an EVPN-VXLAN network.
Action
From operational mode, enter the show protocols sflow
command.
user@switch> show protocols sflow sFlow : Enabled Adaptive fallback : Disabled Sample limit : 300 packets/second Sample limit Threshold : 0 packets/second Polling interval : 0 second Sample rate egress : 1:2048: Disabled Sample rate ingress : 1:100: Enabled Agent ID : 10.1.12.0/24 Source IP address : 10.1.12.0