Check Your Site's Beam Density Coverage
Troubleshoot location issues by using the Beam Density Map to find weak spots in your BLE coverage.
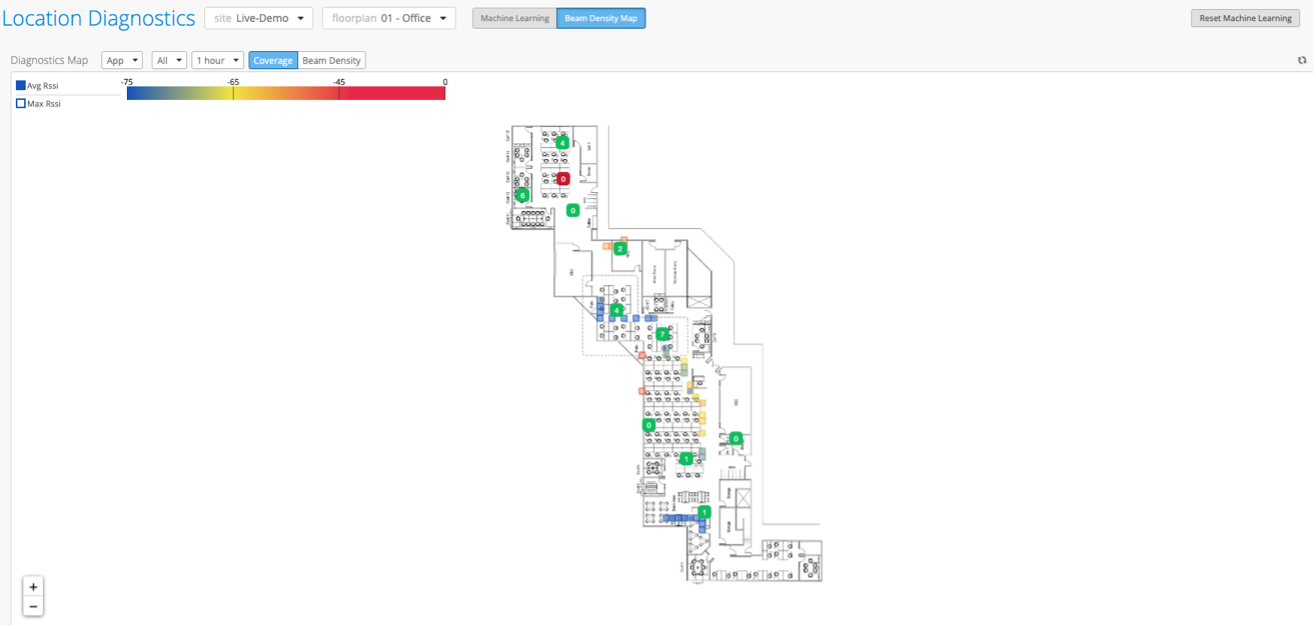
On the Location Diagnostics page of the Juniper Mist portal, you have the option to view “coverage” on the Beam Density Map. This map displays color coding to indicate how much coverage a Mist Access Point (AP) is providing a device based on the device's proximity to the AP. This color coding is based on the Received Signal Strength Indicator (RSSI) that the device sends to the AP. The RSSI values are based on the device’s coordinate (X,Y) location estimate.
To view the Beam Density Coverage Map:
-
Ensure that you have the appropriate site and floorplan selected:

-
Click Coverage.

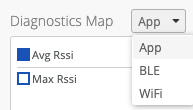
On the map, you have the option to view coverage for App (Mist SDK Mobile App clients), BLE (named assets), and WiFi (unconnected and connected WiFi clients). Select the device type from the drop-down list to view the coverage for that device type on the map. The App device type is the only device type that has the Beam Density option available in addition to Coverage.
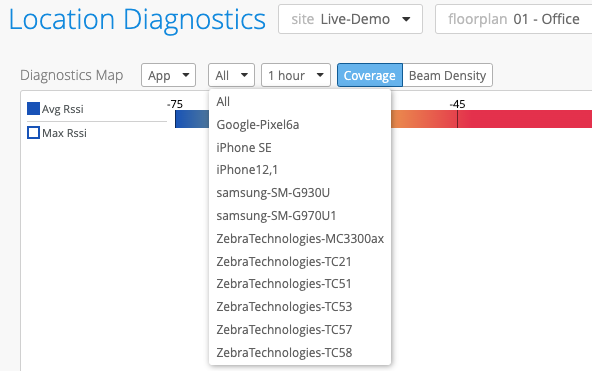
You can choose to view All clients (selected by default), or you can select a specific client from the drop-down list (the options that appear depend on the device type that you select).
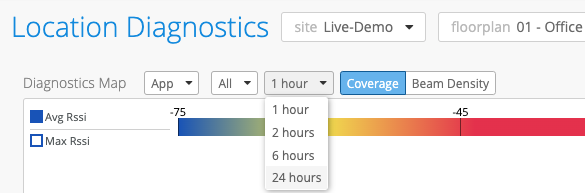
You can also select a time range for which to view coverage. For example, if you would like to see coverage from the past hour, you can select “1 hour”.
-
Notice the RSSI color scale in the top left corner of the page. Use this as your
reference as you look at the coverage on the map. RSSI values closer to zero indicate that
the device is in closer proximity to the APs.