Radio Management (page)
Navigation
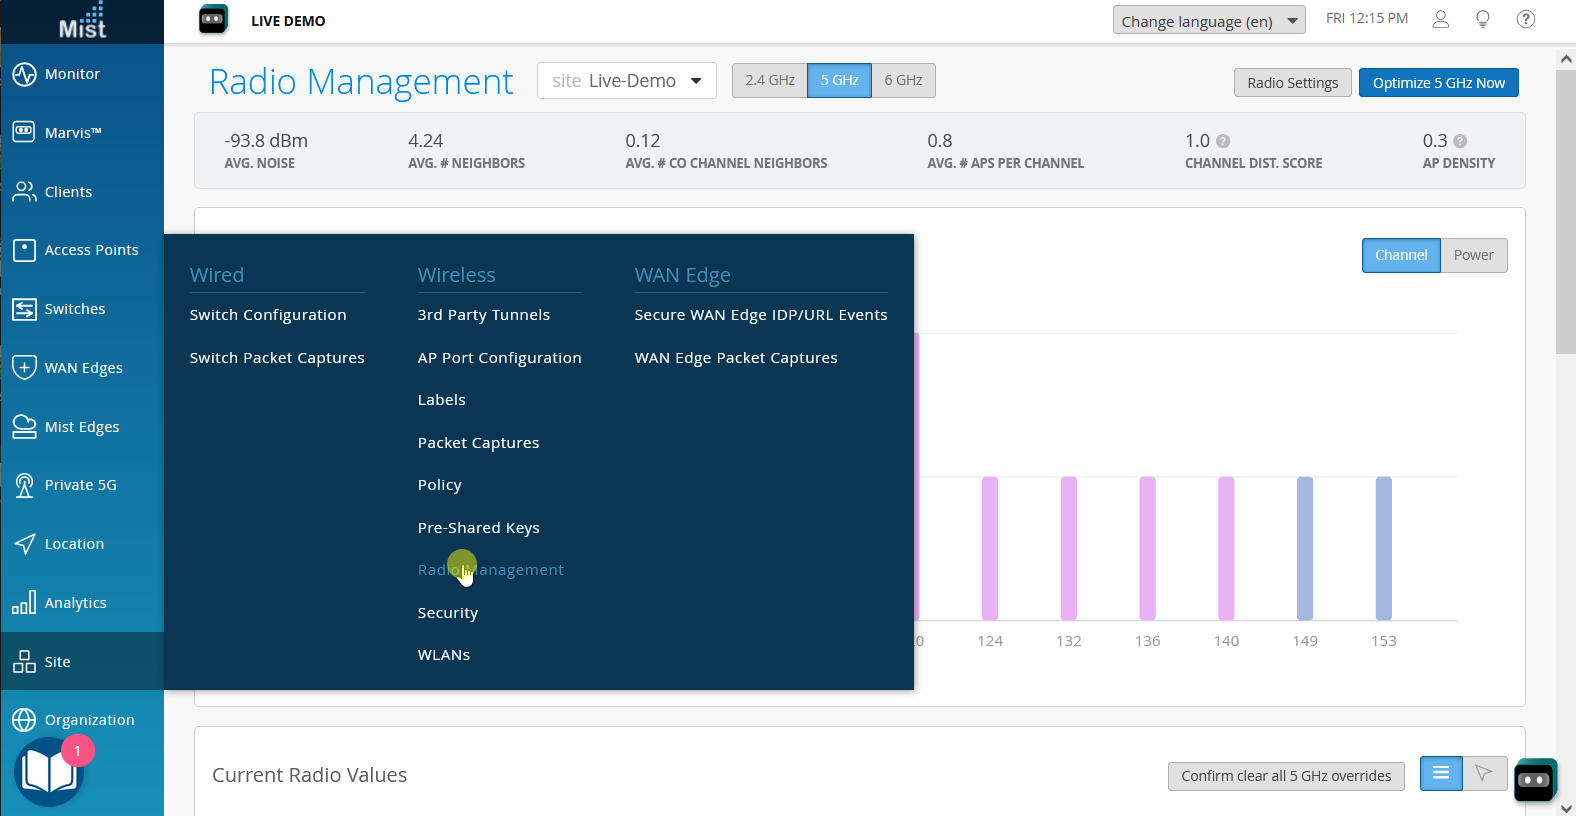
The Radio Management page (Site > Radio Management) provides a consolidated view of Juniper APs in the site. For example, you can see site-wide radio settings for a given radio band, view your overall channel and power distribution, and monitor RRM events.

- (1) The Site selection controls which site in the organization you are viewing.
- (2) The 2.4 GHz, 5 GHz, and 6 GHz radio frequency buttons control which radio band in the site you are viewing.
- (3) The Radio Settings button opens a summary of the site radio settings. From the page that opens, you can also see the radio configuration setting page and jump to Radio Frequency (RF) templates. RF templates provide a way to make uniform radio configurations that are shared by all sites in your organization.
- (4) The Optimize Now button manually pushes configuration changes to the APs for the selected radio band. This action shows up as a Triggered site RRM in the Check Radio Events table. Note that optimizations based on reinforcement learning from the past 24 to 48 hours are automatically pushed to the Juniper APs each night. Note too that local RRM events, such as reacting to channel interference and DFS events, occur on the AP immediately, as needed.
Below the button bar, the summary band provides a snapshot of AP health and performance.
-
Avg Noise—This value indicates the overall noise floor for all APs in the site on the selected radio band. Individual Juniper APs can automatically adjust to instances of high noise, but a high Avg Noise score site-wide can explain poor Wi-Fi experience and prompt a search for the source of the interference.
-
Avg Neighbors—This value indicates the average number of Juniper APs (not SSIDs) in the site that are hearing each other on the selected radio band.
-
Avg Co-Channel Neighbors—This value indicates how many APs are broadcasting the same channel. It is the average for all Juniper AP in the site. A high number here can explain frequent co-channel interference on the site. Individually, RRM on the APs will try to manage co-channel interference, but site-wide, it can indicate something like high AP density. Following the initial deployment, this metric can also server as a quick check on whether physical installation of the APs complies with your deployment policy.
-
Avg APs Per Channel—This value is a count of Juniper APs in the site that are using a given channel and is often considered in conjunction with Channel Distribution. Since the number of available channels varies by band, you need to consider the radio band as context for this value.
Note:You can set an RSSI threshold for neighbor detection on the Organization > Site Configuration page (in the Security Configuration section, the option appears when you select Detect Rogue and Neighbor APs).
-
Channel Distribution—Values here range from 1 to 0, with 1 being uniform distribution, for example, the APs are not all broadcasting the same few channels. Anything below a value of 1 is something you may want to look into.
- AP Density—Values here also range from 1 to 0, with 1 indicating that all APs can hear one another. Values below 1 indicate that at least some of the APs are out of range of one another, or there's a problem with a scanning radio. A value of 0.7 to 0.8 or so is considered optimal.
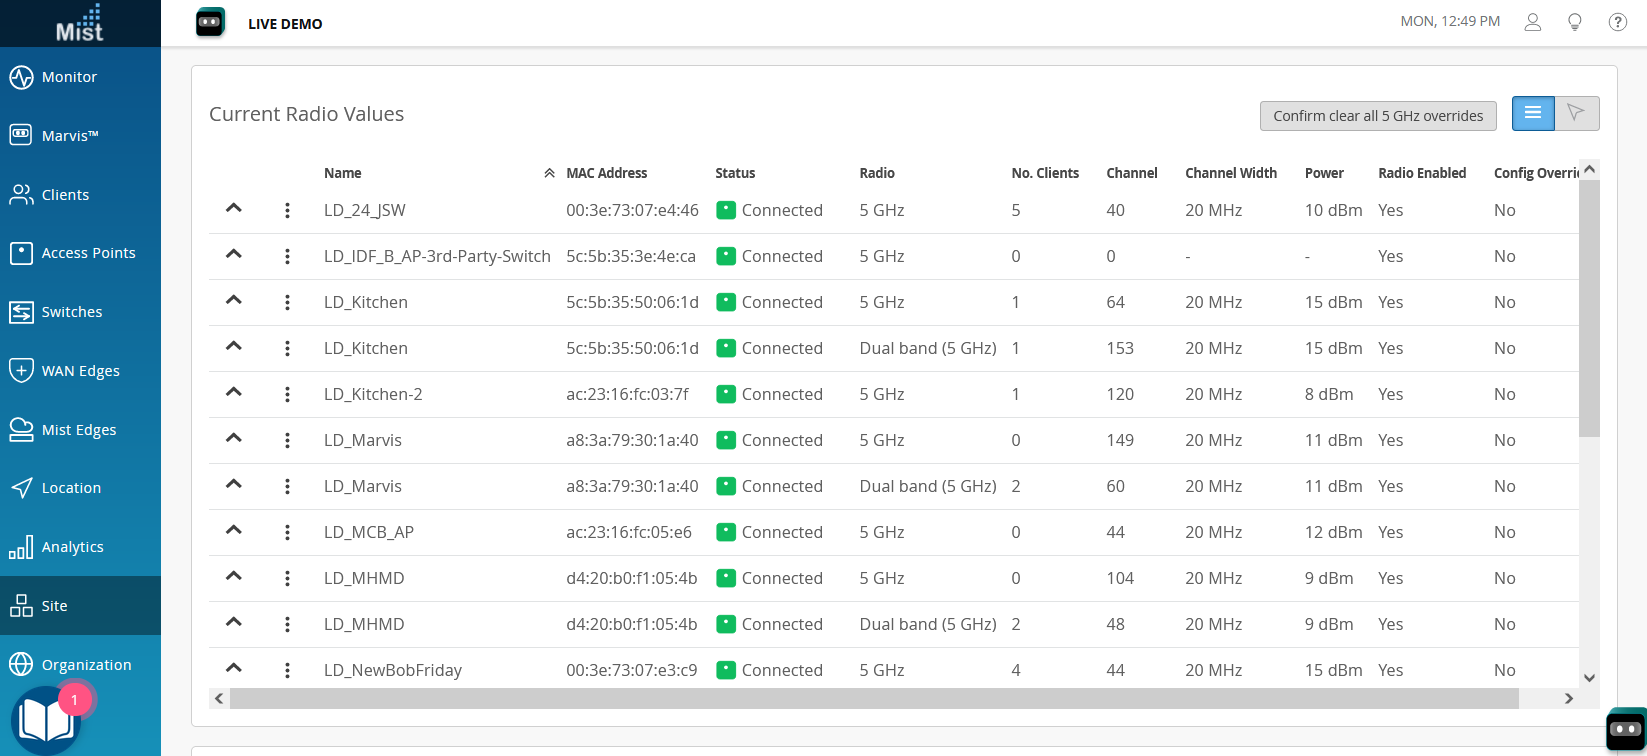
Current Radio Values
Current Radio Values are given per site, and per radio band (2.4-GHz, 5-GHz, or 6-GHz). You select those parameters at the top of the page. They provide a summary of key details for each AP on the site, similar to the Access Points page on the dashboard. For any of the parameters shown in the table, you can drill down for further details. You can also change the view so you can see AP placement relative to the floor plan.
Use your browser's Refresh button to replay the illustration.
The drop-down and stacked dot controls at the beginning of each row (as shown above) have the following functions:
-
Channel occupancy is shown per radio band, for the past 20 minutes (requires AP firmware version 0.09 or later). The channels occupied by the AP are shown in bold.
-
Shortcut to the AP configuration page for the given AP.
-
Shortcut to Wireless SLEs.
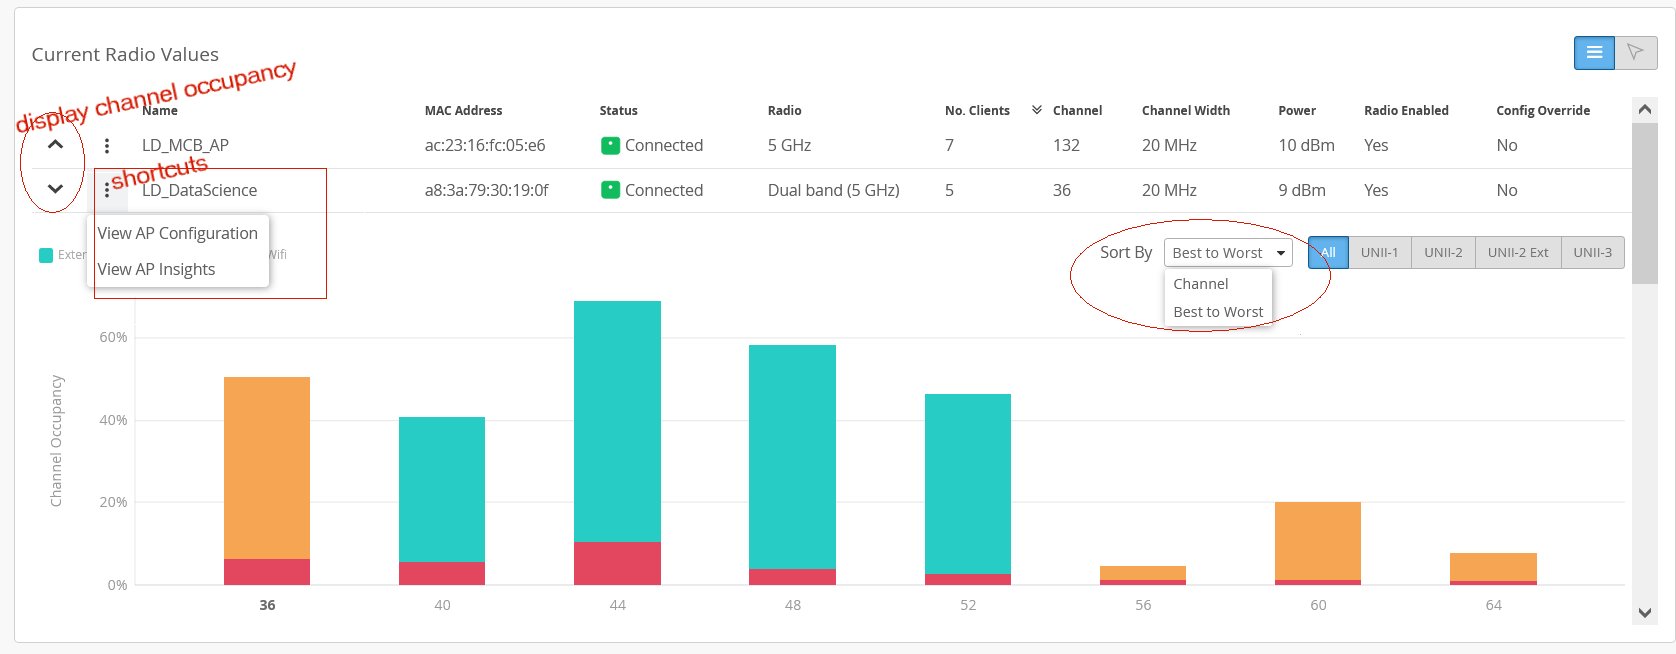
The channel occupancy chart uses data collected for the Capacity SLE for the selected site and radio band. It tells you at a glance how well the site or WLAN is adhering to your channel plan for the selected radio band. For example, columns that are mostly aqua or red indicate right away that you clients aren't using the channel because the AP is not offering it, because SLE telemetry indicates that there is a lot of interference from non-Wi-Fi devices or near-by APs that are not in your WLAN.
You can quickly find the root cause by clicking the shortcut to the Wireless SLEs, where you can drill down on the Capacity metric and look for the sub-metric that is contributing most to the issue.
Distribution
The Distribution chart gives an aggregate picture of how channels usage and power levels are distributed across a site.
You can use the channel view to identify potential interference from co-channel neighbors, or to see whether certain channels are overrepresented or underrepresented at the location.
-
Use the Power view to see how many radios (not APs) in the site are transmitting at a given power level.
-
Sort by Best to Worst to emphasize APs where channel occupancy is highest.
Radio Events
In this chart, you can see a list of radio events from the past 24 hours or 7 days, including channel, bandwidth, and AP power. You can also see what triggered the update, for example, a scheduled RRM from the Mist cloud, a reaction to co-channel interference on the AP, or manual changes that were pushed to the AP.
Use your browser's Refresh button to replay the illustration.
Dynamic Frequency Selection (DFS) is a Wi-Fi function you can use with 5-GHz radios to leverage channels that are generally reserved for radar. These channels vary by country, so for different countries, the DFS channels listing will be different. In the United States, FCC regulations require that whenever the AP detects radar, it must immediately switch from the current operating channel to a random channel. Connected clients will need to reassociate with the AP.
In Mist, after 30 minutes, for non-static channel assignments, RRM then assigns a new, best-available channel according to current RRM scan data (this may be the original channel). For static channel assignments, the AP will resume using the configured channel.
- Scheduled site RRM indicates routine optimizations pushed from the Mist portal. See Radio Management.
- Triggered site RRM indicates a manual update, that is, updates pushed by the Optimize Now button. See WLAN Changes That Reset The Radio.
- Auto channel selection indicates the occurrence of an RRM refresh. For example, APs added to a site will automatically receive RF settings configured for the site.
- Auto Triggered ACS occurs an hour or so following an automatic channel selection. RRM compares the channel plan on a given AP against its analytics to determine whether further optimization is possible.
- Interference AP co-channel indicates that RRM changed channels on the AP, most likely to improve performance due to neighboring APs using the same or overlapping channel. Because wireless is half-duplex (shared medium), sharing the same channel degrades performance as the APs spend air time waiting for the channel to clear before they can send. Connected clients will be re-associated with the AP upon the channel change.
- Interference AP non wifi occurs when 802.11 devices such as a microwave oven or wireless video camera, create interference due to broad RF spectrum emissions. The AP will change to another channel to improve the signal. Connected clients will be re-associated with the AP upon the channel change.
- Radar detected occurs on APs that are using DFS channels whenever radar is detected. The AP will immediately change to the next-best channel. Connected clients will have re-associated with the AP upon the channel change.
- Post Radar occurs as a follow-up to radar detection. The AP will have changed to a different channel upon detecting radar. Sometime subsequent to that change, the AP will automatically review the channel selection it made to see if a better channel is available (and if so, change the channel again).