WAN SLEs
SUMMARY Get started using the WAN Service-Level Experiences (SLEs) dashboard to assess the service levels for user-impacting factors such as WAN Edge health, WAN link health, and application health.
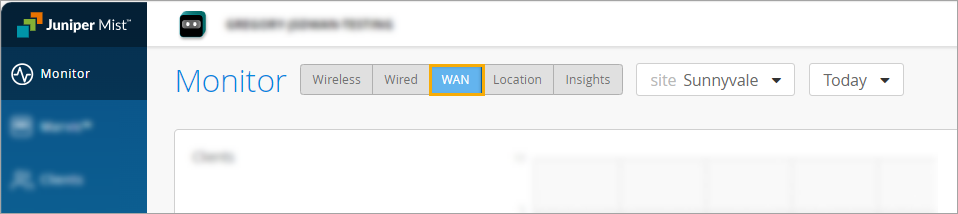
Finding the WAN SLEs Dashboard
To find the WAN SLEs dashboard, select Monitor > Service Levels from the left menu of the Juniper Mist™ portal, and then select the WAN button.
The buttons appear only if you have the required subscriptions. See Requirements.
WAN Assurance Video Overview
Juniper MIST WAN Assurance delivers insights and troubleshooting driven by MIST AI into the WAN, exposing many factors that impact user experience across your distributed enterprise. WAN Assurance complements your SD-WAN deployment and is focused on delivering the best user experience, from client to the cloud. SD-WAN solutions dynamically optimize traffic flows across the WAN based on an SLA policy for your applications.
However, these SLAs are set once at the beginning and don't account for changes over time that impact the WAN, rendering these static SLAs ineffective. In contrast, WAN Assurance is centered around the concept of the user minute, which is represented by Service Level Expectations, or SLE for short. If a user is experiencing a poor Microsoft Teams call, then the user is having bad user minutes.
Let's see what this looks like in a Juniper Cloud instance. From the monitor view, we select WAN, choosing from the time frame over the last seven days, and we see three SLEs for the WAN. The first one is Gateway Health, which accounts for the overall state of the SRX WAN edge device itself.
We track CPU, memory, temperature, fan, and power, all of which account for the overall device health. WAN Link Health represents the overall state of the WAN connections to the device. It tracks IPsec status, routing, and the WAN interfaces.
Thirdly, there's App Experience, which accounts for factors that impact application performance based on traffic. This SLE tracks latency, jitter, packet loss, and round-trip time. Together, these three SLEs describe how WAN performance is impacting overall user experience.
Let's ask Marvis what's happening with Microsoft Teams. By simply typing, obvious Teams call is bad, Marvis begins a root cause analysis. Marvis first responds by listing five Teams sessions from the past 24 hours.
We select the troublesome session from the list. Marvis quickly responds that the bad Teams experience was due to high latency on the Gateway SRX. Marvis also shows where the issue is in a simplified network diagram.
It displays how Abhi's MacBook is connected wirelessly to an access point, which in turn is connected to an EX access switch, and finally, the traffic is sent to the WAN via the SRX gateway. Marvis visually shows how each of these points in the network are impacting user experience. We see the AP and the gateway devices may be impacting experience.
We click the AP first. There is some non-WiFi interference in the 5GIG band that could be impacting users. Next, we select the gateway device.
We see it has high latency in one of its WAN links due to slow response from the application server. Marvis makes it that easy to determine root cause analysis of issues impacting user experience. By correlating across Wi-Fi, wired, and WAN, we are able to drive a better user experience within our sites, out of our sites, from client to cloud.
Using the WAN SLE Dashboard
For a general introduction to SLEs, see Service Level Expectations (SLE).
For help interpreting the WAN SLEs and classifiers, explore the other WAN SLE topics in this chapter.