Help us improve your experience.
Let us know what you think.
Do you have time for a two-minute survey?
Help us improve your experience.
Let us know what you think.
Do you have time for a two-minute survey?
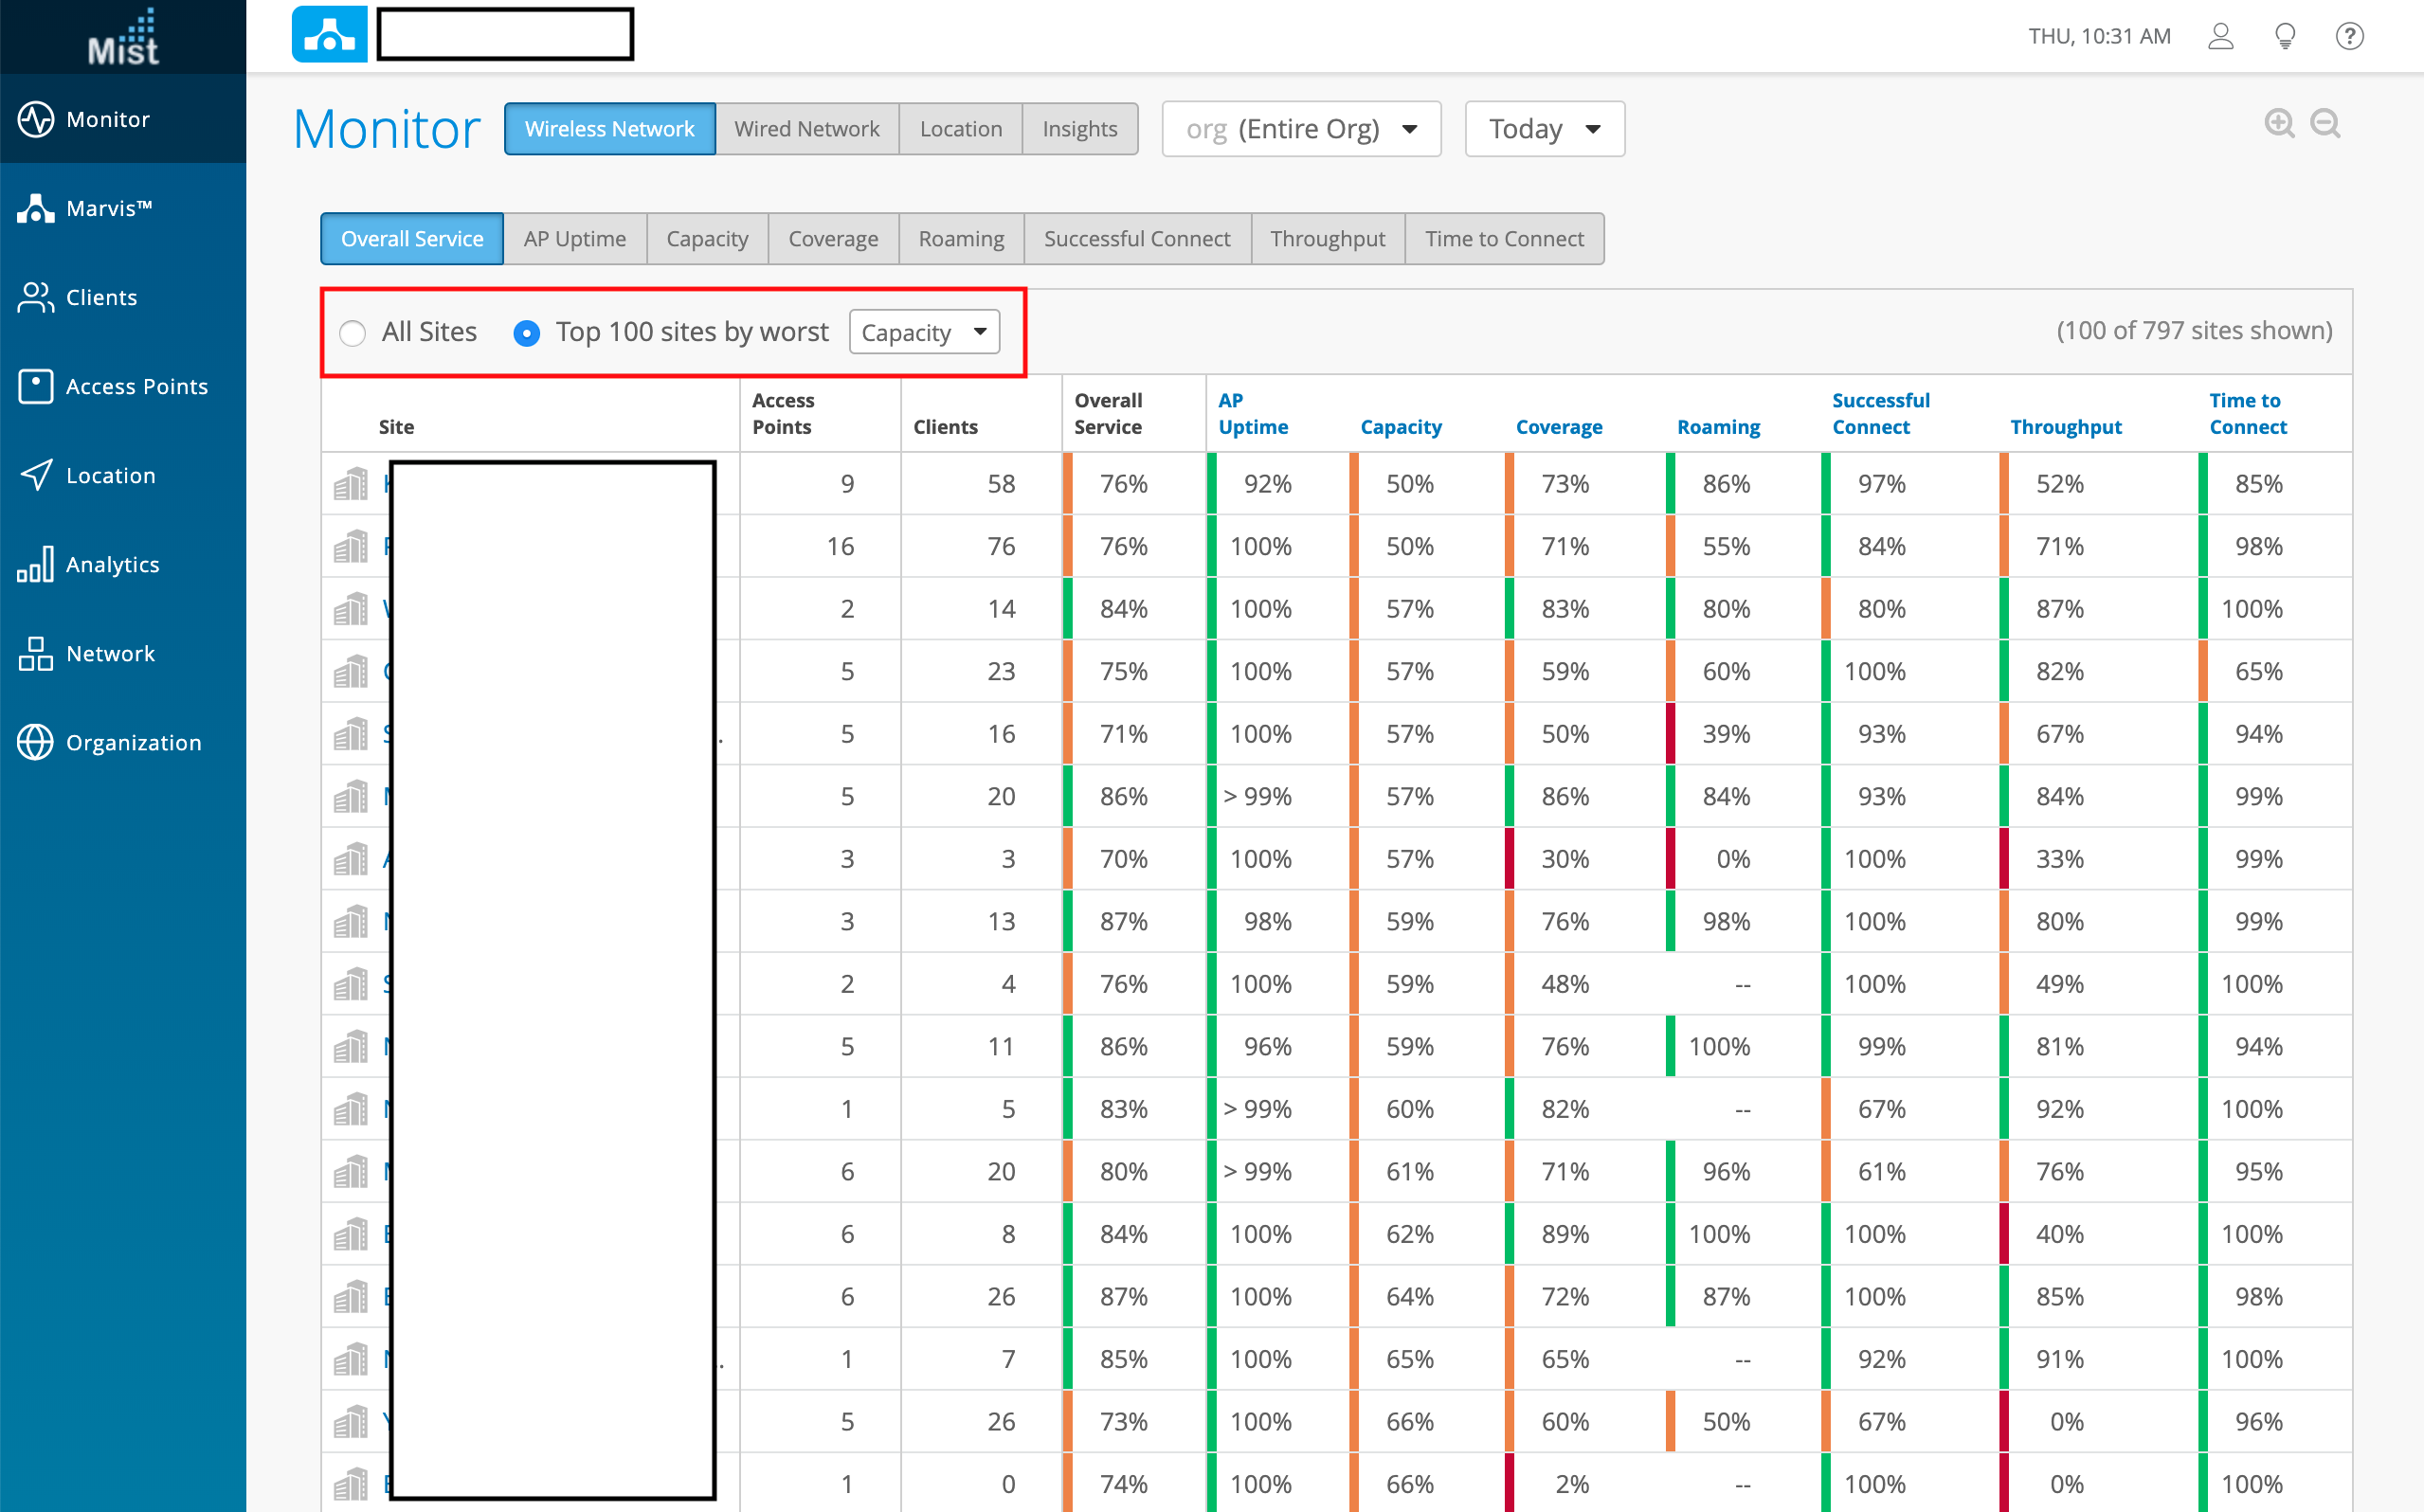
The SLE view across the org, ranked by the worst 100 performing sites helps network admins monitor the health of all sites throughout an organization. For example, use this feature to quickly show the top 100 sites experiencing Capacity issues.
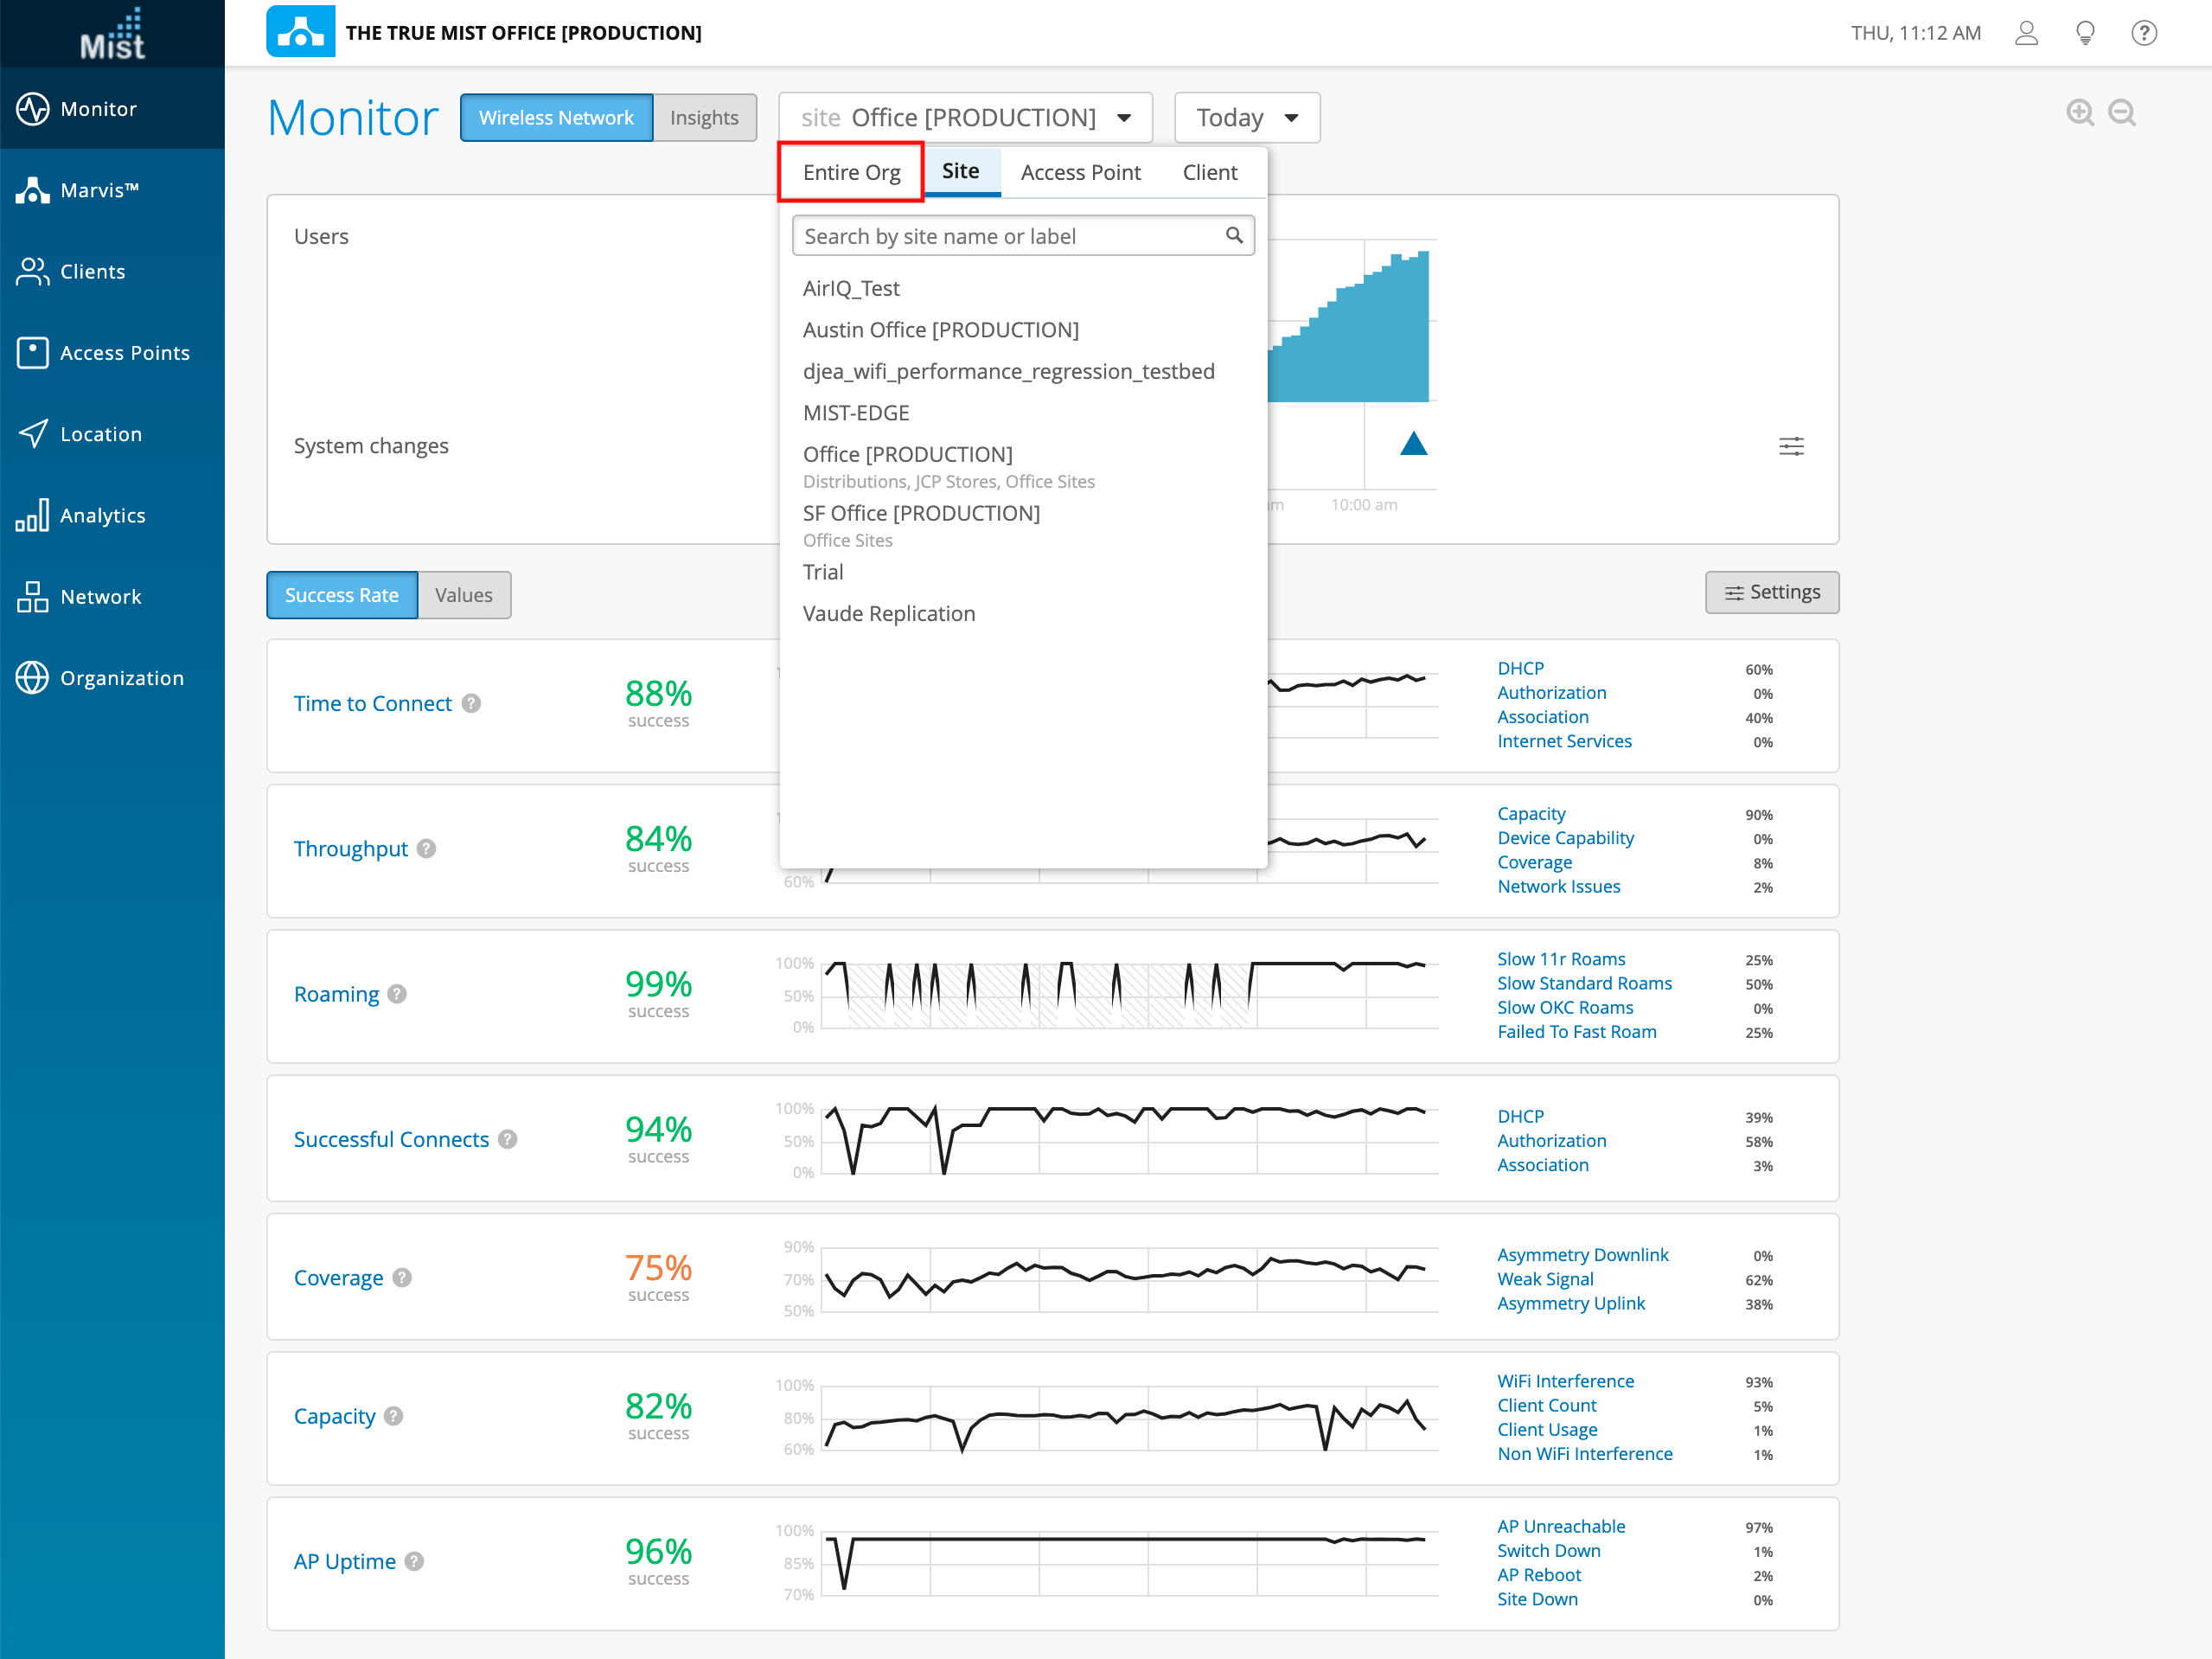
To access Org SLE, navigate to Monitor and select the Wireless Service Levels tab at the top. In the site selector dropdown, select the Entire Org tab.
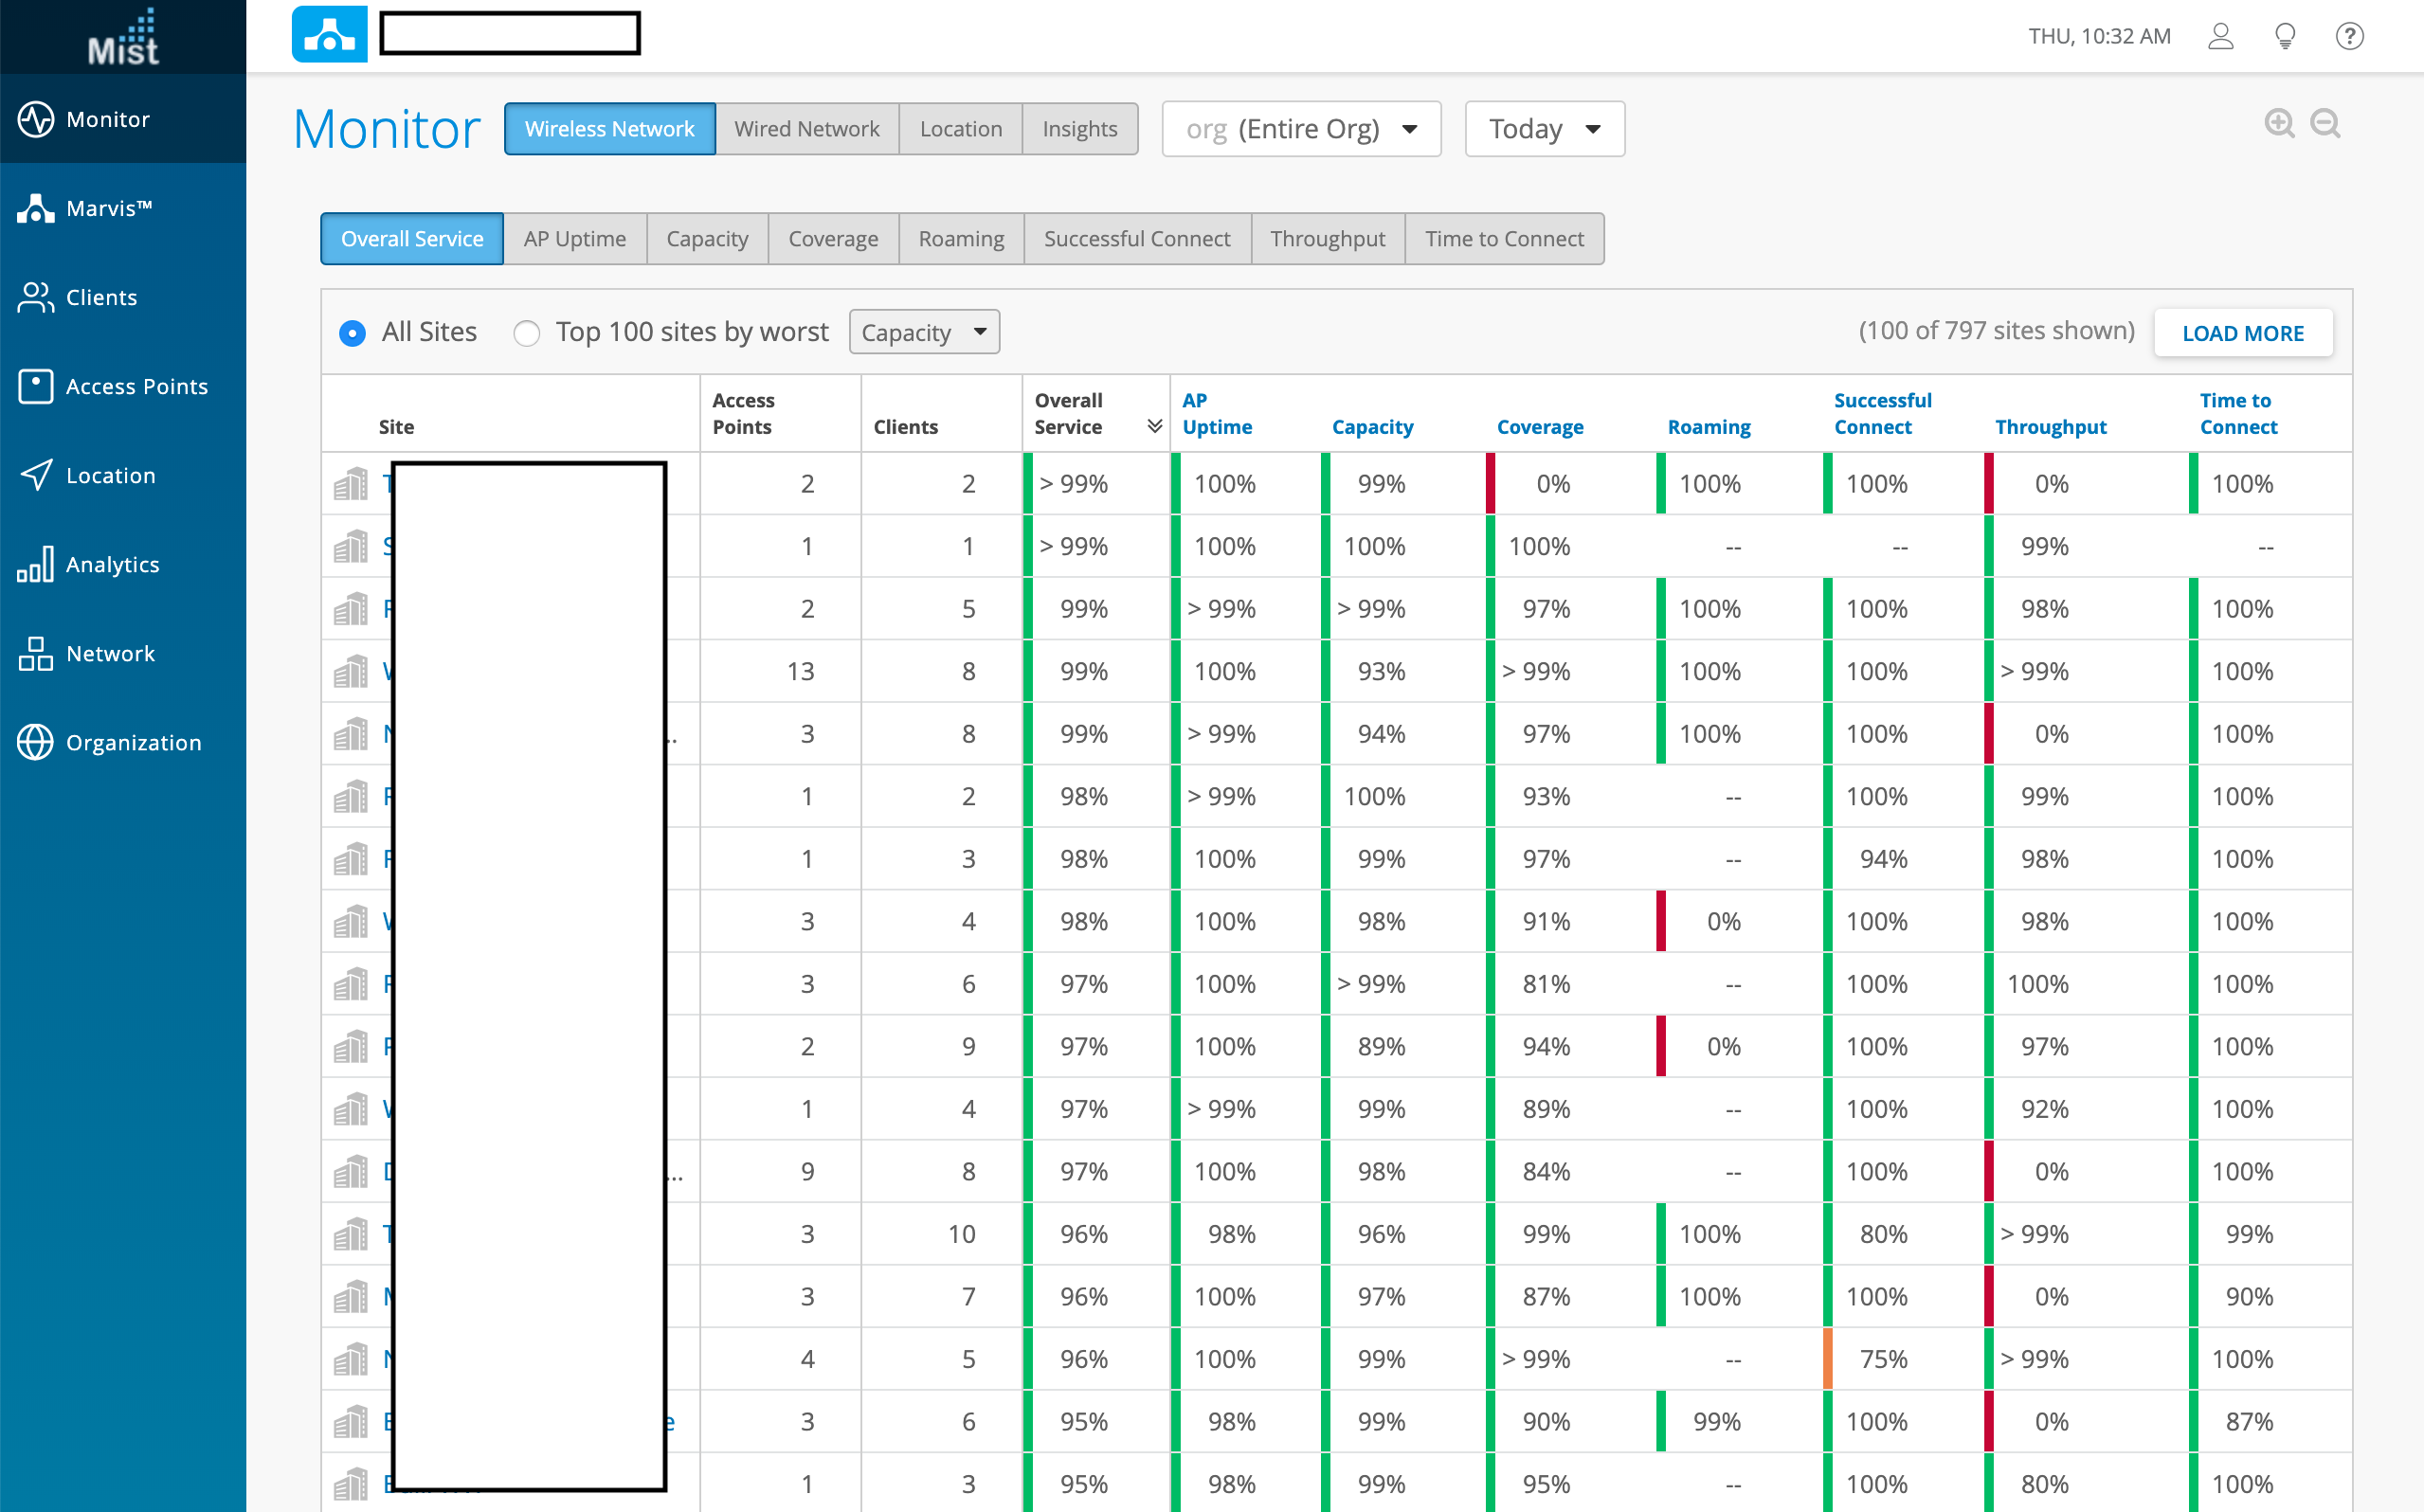
The default view shows 100 of your sites. You may select the Load More button to load additional sites in this view (100 more each time)
To sort by the worst 100 sites for an SLE, select the Top 100 sites by worst button and in the dropdown selector specify the SLE. Here, we are choosing to display the 100 worst sites with Capacity issues.