ON THIS PAGE
NorthStar Controller Troubleshooting Guide
This document includes strategies for identifying whether an apparent problem stems from the NorthStar Controller or from the router, and provides troubleshooting techniques for those problems that are identified as stemming from the NorthStar Controller.
Before you begin any troubleshooting investigation, confirm that all system processes are up and running. A sample list of processes is shown below. Your actual list of processes could be different.
[root@node-1 ~]# supervisorctl status
bmp:bmpMonitor                   RUNNING   pid 2957, uptime 0:58:02
collector:worker1                RUNNING   pid 19921, uptime 0:01:42
collector:worker2                RUNNING   pid 19923, uptime 0:01:42
collector:worker3                RUNNING   pid 19922, uptime 0:01:42
collector:worker4                RUNNING   pid 19924, uptime 0:01:42
collector_main:beat_scheduler    RUNNING   pid 19770, uptime 0:01:53
collector_main:es_publisher      RUNNING   pid 19771, uptime 0:01:53
collector_main:task_scheduler    RUNNING   pid 19772, uptime 0:01:53
config:cmgd                      RUNNING   pid 22087, uptime 0:01:53
config:cmgd-rest                 RUNNING   pid 22088, uptime 0:01:53
docker:dockerd                   RUNNING   pid 4368, uptime 0:57:34
epe:epeplanner                   RUNNING   pid 9047, uptime 0:50:34
infra:cassandra                  RUNNING   pid 2971, uptime 0:58:02
infra:ha_agent                   RUNNING   pid 9009, uptime 0:50:45
infra:healthmonitor              RUNNING   pid 9172, uptime 0:49:40
infra:license_monitor            RUNNING   pid 2968, uptime 0:58:02
infra:prunedb                    RUNNING   pid 19770, uptime 0:01:53
infra:rabbitmq                   RUNNING   pid 7712, uptime 0:52:03
infra:redis_server               RUNNING   pid 2970, uptime 0:58:02
infra:zookeeper                  RUNNING   pid 2965, uptime 0:58:02
ipe:ipe_app                      RUNNING   pid 2956, uptime 0:58:02
listener1:listener1_00           RUNNING   pid 9212, uptime 0:49:29
netconf:netconfd_00              RUNNING   pid 19768, uptime 0:01:53
northstar:anycastGrouper         RUNNING   pid 19762, uptime 0:01:53
northstar:configServer           RUNNING   pid 19767, uptime 0:01:53
northstar:mladapter              RUNNING   pid 19765, uptime 0:01:53
northstar:npat                   RUNNING   pid 19766, uptime 0:01:53
northstar:pceserver              RUNNING   pid 19441, uptime 0:02:59
northstar:privatet1vproxy        RUNNING   pid 19432, uptime 0:02:59
northstar:prpdclient             RUNNING   pid 19763, uptime 0:01:53
northstar:scheduler              RUNNING   pid 19764, uptime 0:01:53
northstar:topologyfilter         RUNNING   pid 19760, uptime 0:01:53
northstar:toposerver             RUNNING   pid 19762, uptime 0:01:53
northstar_pcs:PCServer           RUNNING   pid 19487, uptime 0:02:49
northstar_pcs:PCViewer           RUNNING   pid 19486, uptime 0:02:49
web:app                          RUNNING   pid 19273, uptime 0:03:18
web:gui                          RUNNING   pid 19280, uptime 0:03:18
web:notification                 RUNNING   pid 19272, uptime 0:03:18
web:proxy                        RUNNING   pid 19275, uptime 0:03:18
web:restconf                     RUNNING   pid 19271, uptime 0:03:18
web:resthandler                  RUNNING   pid 19275, uptime 0:03:18
Restart any processes that display as STOPPED instead of RUNNING.
To stop, start, or restart all processes, use the service northstar stop, service northstar start, and service northstar restart commands.
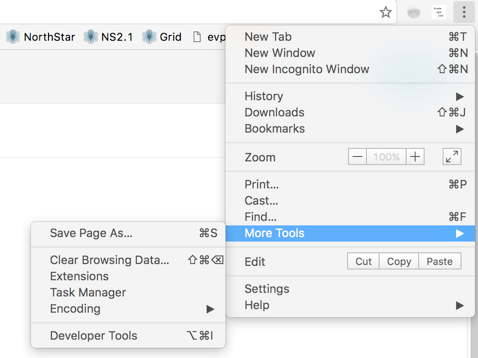
To access system process status information from the NorthStar Controller Web UI, navigate to More Options>Administration and select System Health.
The current CPU %, memory usage, virtual memory usage, and other statistics for each system process are displayed. Figure 1 shows an example.
Only processes that are running are included in this display.
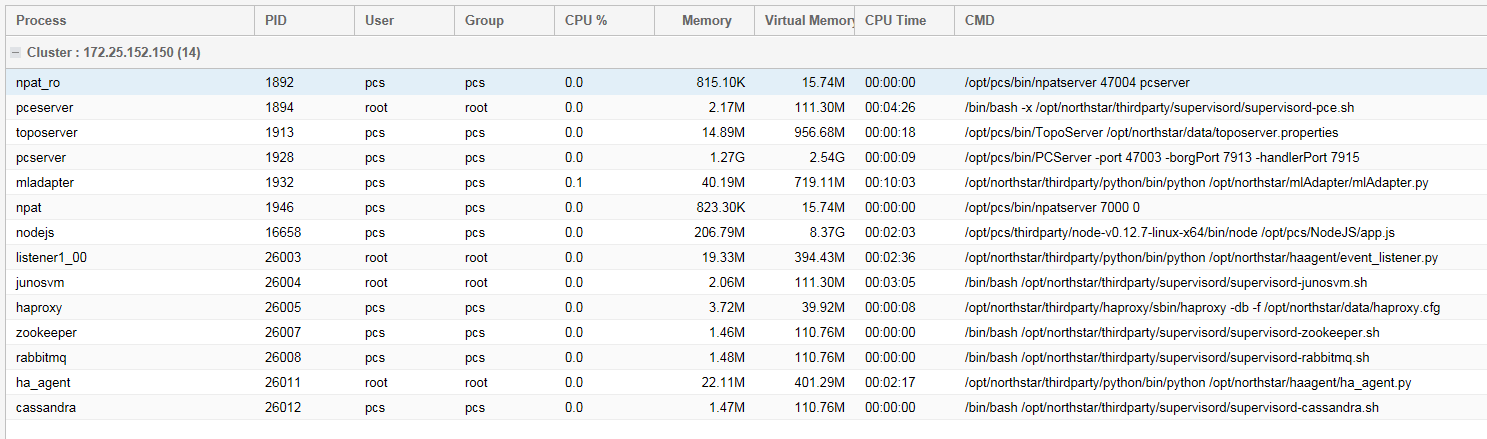
Table 1 describes each field displayed in the Process Status table.
| Field | Description |
|---|---|
Process |
The name of the NorthStar Controller process. |
PID |
The Process ID number. |
User |
The NorthStar Controller user permissions required to access information about this process. |
Group |
NorthStar Controller user group permissions required to access information about this process. |
CPU% |
Displays current percentage of CPU currently in use by this process. |
Memory |
Displays current percentage of memory currently in use by this process. |
Virtual Memory |
Displays current Virtual memory in use by this process. |
CPU Time |
The amount of time the CPU was used for processing instructions for the process |
CMD |
Displays the specific command options for the system process. |
The troubleshooting information is presented in the following sections:
NorthStar Controller Log Files
Throughout your troubleshooting efforts, it can be helpful to view various NorthStar Controller log files. To access log files:
Log in to the NorthStar Controller Web UI.
Navigate to More Options > Administration and select Logs.
A list of NorthStar system log and message files is displayed, a truncated example of which is shown in Figure 2.
Figure 2: Sample of System Log and Message Files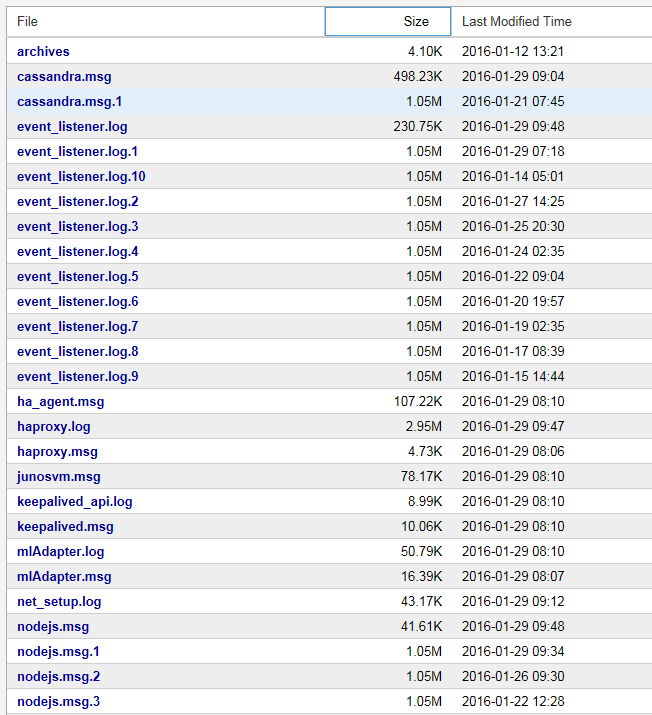
Click the log file or message file that you want to view.
The log file contents are displayed in a pop-up window.
To open the file in a separate browser window or tab, click View Raw Log in the pop-up window.
To close the pop-up window and return to the list of log and message files, click X in the upper right corner of the pop-up window.
Table 2 lists the NorthStar Controller log files most commonly used to identify and troubleshoot issues with the PCS and PCE.
Log File |
Description |
Location |
|---|---|---|
pcep_server.log |
Log entries related to the PCEP server. The PCEP server maintains the PCEP session. The log contains information about communication between the PCC and the PCE in both directions. To configure verbose PCEP server logging:
|
/var/log/jnc |
pcs.log |
Log entries related to the PCS. The PCS is responsible for path computation. This log includes events received by the PCS from the Toposerver, including provisioning orders. It also contains notification of communication errors and issues that prevent the PCS from starting up properly. |
/opt/northstar/logs |
toposerver.log |
Log entries related to the topology server. The topology server is responsible for maintaining the topology. These logs contain the record of the events between the PCS and the Toposerver, the Toposerver and NTAD, and the Toposerver and the PCE server |
/opt/northstar/logs |
Table 3 lists additional log files that can also be helpful for troubleshooting. All of the log files in Table 3 are located under the /opt/northstar/logs directory.
| Log Files | Description |
cassandra.msg |
Log events related to the cassandra database. |
ha_agent.msg |
HA coordinator log. |
mlAdaptor.log |
Interface to transport controller log. |
net_setup.log |
Configuration script log. |
nodejs.msg |
Log events related to nodejs. |
pcep_server.log |
Log files related to communication between the PCC and the PCE in both directions. |
pcs.log |
Log files related to the PCS, which includes any event received by PCS from Toposerver and any event from Toposerver to PCS including provisioning orders. This log also contains any communication errors as well as any issues that prevent the PCS from starting up properly. |
rest_api.log |
Logs files of REST API requests. |
toposerver.log |
Log files related to the topology server. Contains the record of the events between the PCS and topology server, the topology server and NTAD, and the topology server and the PCE server Note:
Any message forwarded to the pcshandler.log file is also forwarded to the pcs.log file. |
To see logs related to the Junos VM, you must establish a telnet session to the router. The default IP address for the Junos VM is 172.16.16.2. The Junos VM is responsible for maintaining the necessary BGP, ISIS, or OSPF sessions.
Empty Topology
Figure 3 illustrates the flow of information from the router to the Toposerver that results in thepng topology display in the NorthStar Controller UI. When the topology display is empty, it is likely this flow has been interrupted. Finding out where the flow was interrupted can guide your problem resolution process.

The topology originates at the routers. For NorthStar Controller to receive the topology, there must be a BGP-LS, ISIS, or OSPF session from one of the routers in the network to the Junos VM. There must also be an established Network Topology Abstractor Daemon (NTAD) session between the Junos VM and the Toposerver.
To check these connections:
Using the NorthStar Controller CLI, verify that the NTAD connection between the Toposerver and the Junos VM was successfully established as shown in this example:
[root@northstar ~]# netstat -na | grep :450

tcp        0      0 172.16.16.1:55752           172.16.16.2:450             ESTABLISHED
Note:Port 450 is the port used for Junos VM to Toposerver connections.
In the following example, the NTAD connection has not been established:
[root@northstar ~]# netstat -na | grep :450

tcp        0      0 172.16.16.1:55752           172.16.16.2:450             LISTENING
Log in to the Junos VM to confirm whether NTAD is configured to enable topology export. The grep command below gives you the IP address of the Junos VM.
[root@northstar ~]# grep "ntad_host" /opt/northstar/data/northstar.cfg

ntad_host=172.16.16.2
[root@northstar ~]# telnet 172.16.16.2

Trying 172.16.16.2...
Connected to 172.16.16.2.
Escape character is '^]'.

northstar_junosvm (ttyp0)


login: northstar
Password:

--- JUNOS 14.2R4.9 built 2015-08-25 21:01:39 UTC

This JunOS VM is running in non-persistent mode.
If you make any changes on this JunOS VM,
Please make sure you save to the Host using net_setup.py utility, otherwise the config will be lost if this VM is restarted.

northstar@northstar_junosvm> show configuration protocols | display set

set protocols topology-export
If the
topology-exportstatement is missing, the Junos VM cannot export data to the Toposerver.Use Junos OS
showcommands to confirm whether the BGP, ISIS, or OSPF relationship between the Junos VM and the router is ACTIVE. If the session is not ACTIVE, the topology information cannot be sent to the Junos VM.On the Junos VM, verify whether the lsdist.0 routing table has any entries:
northstar@northstar_junosvm> show route table lsdist.0 terse | match lsdist.0

lsdist.0: 54 destinations, 54 routes (54 active, 0 holddown, 0 hidden)
If you see only zeros in the lsdist.0 routing table, there is no topology that can be sent. Review the NorthStar Controller Getting Started Guide sections on configuring topology acquisition.
Ensure that there is at least one link in the lsdist.0 routing table. The Toposerver can only generate an initial topology if it receives at least one NTAD link event. A network that consists of a single node with no IGP adjacency with other nodes (as is possible in a lab environment, for example), will not enable the Toposerver to generate a topology. Figure 4 illustrates the Toposerver’s logic process for creating the initial topology.
Figure 4: Logic Process for Initial Topology Creation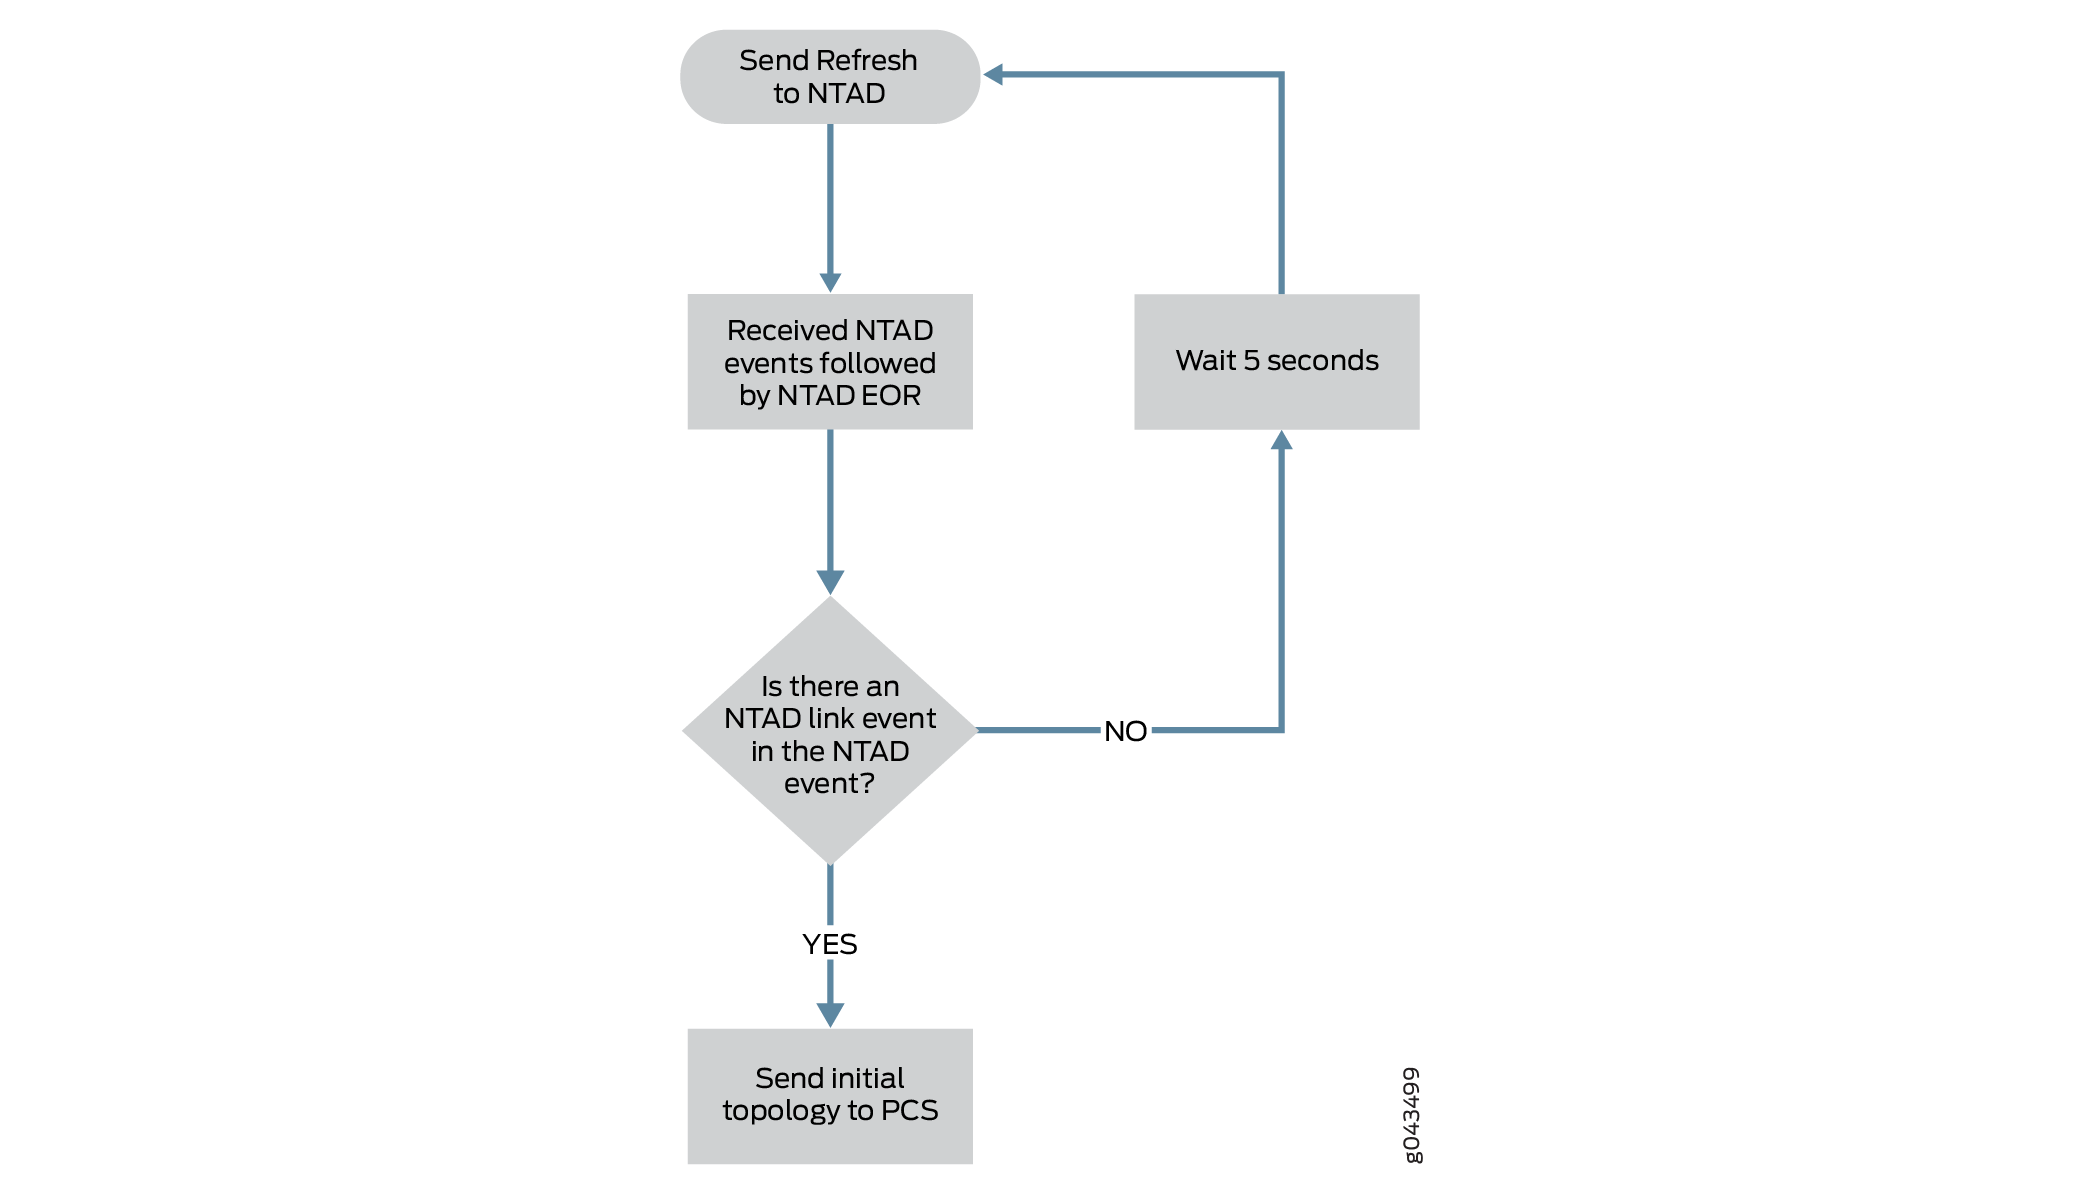
If an initial topology cannot be created for this reason, the toposerver.log generates an entry similar to the following example:
Dec 9 16:03:57.788514 fe-cluster-03 TopoServer Did not send the topology because no links were found.
NTAD Version
If you see that SR LSPs have not been provisioned and the pcs.log shows messages similar to this example:
2020 Apr 27 15:05:36.430366 ns1-site1-q-pod07 PCServer [NorthStar][PCServer][Routing] msg=0x0000300b Provided path is not valid for SR for sean427@0110.0000.0101 path=sean427, node 0110.0000.0104 has no NodeIndex
It might be that the NTAD version is incorrect. See Installing the NorthStar Controller for information on NTAD versions.
Incorrect Topology
One important function of the Toposerver is to correlate the unidirectional link (interface) information from the routers into bidirectional links by matching source and destination IPv4 Link_Identifiers from NTAD link events. When the topology displayed in the NorthStar UI does not appear to be correct, it can be helpful to understand how the Toposerver handles the generation and maintenance of the bidirectional links.
Generation and maintenance of bidirectional links is a complex process, but here are some key points:
For the two nodes constituting each bidirectional link, the Node ID that was assigned first (and therefore has the lower Node ID number) is given the Node A designation, and the other node is given the Node Z designation.
Note:The Node ID is assigned when the Toposerver first receives the Node event from NTAD.
Whenever a Node ID is cleared and reassigned (such as during a Toposerver restart or network model reset), the Node IDs and therefore, the A and Z designations, can change.
The Toposerver receives a Link Update message when a link in the network is added or modified.
The Toposerver receives a Link Withdraw message when a link is removed from the network.
The Link Update and Link Withdraw messages affect the operational status of the nodes.
The node operational status, together with the protocol (IGP versus IGP plus MPLS) determine whether a link can be used to route LSPs. For a link to be used to route LSPs, it must have both an operational status of UP and the MPLS protocol active.
Missing LSPs
When your topology is displaying correctly, but you have missing LSPs, take a look at the flow of information from the PCC to the Toposerver that results in tunnels being added to the NorthStar Controller UI, as illustrated in Figure 5. The flow begins with the configuration at the PCC, from which an LSP Update message is passed to the PCEP server by way of a PCEP session and then to the Toposerver by way of an Advanced Message Queuing Protocol (AMQP) connection.

To check these connections:
Look at the toposerver.log. The log prints a message every 15 seconds when it detects that its connection with the PCEP server has been lost or was never successfully established. Note that in the following example, the connection between the Toposerver and the PCEP server is marked as down.
Toposerver log:
Apr 22 16:21:35.016721 user-PCS TopoServer  Warning, did not receive the PCE beacon within 15 seconds, marking it as down. Last up: Fri Apr 22 16:21:05 2016
Apr 22 16:21:35.016901 user-PCS TopoServer  [->PCS] PCE Down: Warning, did not receive the PCE beacon within 15 seconds, marking it as down. Last up: Fri Apr 22 16:21:05 2016
Apr 22 16:21:50.030592 user-PCS TopoServer  Warning, did not receive the PCE beacon within 15 seconds, marking it as down. Last up: Fri Apr 22 16:21:05 2016
Apr 22 16:21:50.031268 user-PCS TopoServer  [->PCS] PCE Down: Warning, did not receive the PCE beacon within 15 seconds, marking it as down. Last up: Fri Apr 22 16:21:05 2016
Using the NorthStar Controller CLI, verify that the PCEP session between the PCC and the PCEP server was successfully established as shown in this example:
[root@northstar ~]# netstat -na | grep :4189
tcp        0      0 0.0.0.0:4189                0.0.0.0:*                   LISTEN
tcp        0      0 172.25.152.42:4189          172.25.155.50:59143         ESTABLISHED
tcp        0      0 172.25.152.42:4189          172.25.155.48:65083         ESTABLISHED
Note:Port 4189 is the port used for PCC to PCEP server connections.
Knowing that the session has been established is useful, but it does not necessarily mean that any data was transferred.
Verify whether the PCEP server learned about any LSPs from the PCC.
[root@user-PCS ~]# pcep_cli
# show lsp all list
2016-04-22 17:09:39.696061(19661)[DEBUG]: pcc_lsp_table.begin:
2016-04-22 17:09:39.696101(19661)[DEBUG]: pcc-id:1033771436/172.25.158.61, state: 0

2016-04-22 17:09:39.696112(19661)[DEBUG]: START of LSP-NAME-TABLE
…
2016-04-22 17:09:39.705358(19661)[DEBUG]: Summary pcc_lsp_table:
2016-04-22 17:09:39.705366(19661)[DEBUG]:   Summary LSP name tabl:
2016-04-22 17:09:39.705375(19661)[DEBUG]:     client_id:1033771436/172.25.158.61, state:0,num LSPs:13
2016-04-22 17:09:39.705388(19661)[DEBUG]:     client_id:1100880300/172.25.158.65, state:0,num LSPs:6
2016-04-22 17:09:39.705399(19661)[DEBUG]:     client_id:1117657516/172.25.158.66, state:0,num LSPs:23
2016-04-22 17:09:39.705410(19661)[DEBUG]:     client_id:1134434732/172.25.158.67, state:0,num LSPs:4
2016-04-22 17:09:39.705420(19661)[DEBUG]:   Summary LSP id table:
2016-04-22 17:09:39.705429(19661)[DEBUG]:     client_id:1033771436/172.25.158.61, state:0, num LSPs:13
2016-04-22 17:09:39.705440(19661)[DEBUG]:     client_id:1100880300/172.25.158.65, state:0, num LSPs:6
2016-04-22 17:09:39.705451(19661)[DEBUG]:     client_id:1117657516/172.25.158.66, state:0, num LSPs:23
2016-04-22 17:09:39.705461(19661)[DEBUG]:     client_id:1134434732/172.25.158.67, state:0, num LSPs:4
In the far right column of the output, you see the number of LSPs that were learned. If this number is 0, no LSP information was sent to the PCEP server. In that case, check the configuration on the PCC side, as described in the NorthStar Controller Getting Started Guide.
LSP Controller Statuses
You can view the controller status of LSPs in the Controller Status column in the Tunnels tab of the Network Information table (in the NorthStar Controller GUI).
Table 4 lists the various controller statuses and their descriptions.
Controller Status |
Indicates That |
|---|---|
FAILED |
The NorthStar Controller has failed to provision the LSP. |
PENDING |
The PCS has sent an LSP provisioning order to the PCEP sever. The PCS is awaiting a response from the PCEP server. |
PCC_PENDING |
The PCEP server has sent an LSP provisioning order to the PCC. The PCS is awaiting a response from the PCC. |
NETCONF_PENDING |
The PCS has sent an LSP provisioning order to netconfd. The PCS is awaiting a response from netconfd. |
PRPD_PENDING |
The PCS has sent an LSP provisioning order to the PRPD client to provision a BGP route. The PCS is awaiting a response from the PRPD client. |
SCHEDULED_DELETE |
The PCS has scheduled the LSP to be deleted; the PCS will send the deletion provisioning order to the PCC. |
SCHEDULED_DISCONNECT |
The PCS has scheduled the LSP to be disconnected. The LSP will be moved to Shutdown status; the LSP is retained in the NorthStar datastore with a Persist state associated with it and is not used in CSPF calculations. |
NoRoute_Rescheduled |
The PCS hasn’t found a path for the LSP. The PCS will scan the LSPs periodically and will try to find a path for the LSP that hasn’t been routed and then, schedule its reprovisioning. |
FRR_DETOUR_Rescheduled |
The PCS has detoured the LSP and rescheduled the LSP’s re-provisioning. |
Provision_Rescheduled |
The PCS has scheduled the LSP to be provisioned. |
Maint_NotHandled |
The LSP is not part of the ongoing maintenance event as the LSP is not controlled by NorthStar. |
Maint_Rerouted |
The PCS has rerouted the LSP due to maintenance. |
Callsetup_Scheduled |
The PCS must provision the LSP when the event starts. |
Disconnect_Scheduled |
The PCS must disconnect the LSP when the event ends. |
No path found |
The PCS was unable to find a path for the LSP. |
Path found on down LSP |
The PCEP server has reported that the LSP is Down but the PCS has found a path for the LSP. |
Path include loops |
The SR-LSP has one or more loops. |
Maint_NotReroute_DivPathUp |
The LSP is not rerouted due to the maintenance event as there’s a standby path already up and running. |
Maint_NotReroute_NodeDown |
The LSP is not rerouted as the maintenance event is for the endpoints of the LSP. |
PLANNED_LSP |
The LSP must be provisioned but is not in the provisioning queue yet. |
PLANNED_DISCONNECT |
The LSP must be disconnected but is not in the provisioning queue yet. |
PLANNED_DELETE |
The LSP must be deleted but is not in the provisioning queue yet. |
Candidate_ReOptimization |
The PCS has selected the LSP as a candidate for reoptimization. |
Activated(used_by_primary) |
Secondary path for the LSP is activated. |
Time_Expired |
Scheduled window for the LSP has expired. |
PCEP_Capability_not_supported |
PCEP may not be supported on the device, or if supported, PCEP may either not be configured, may be disabled, or misconfigured on the device. |
De-activated |
NorthStar Controller has deactivated the secondary LSP. |
NS_ERR_NCC_NOT_FOUND |
The NorthStar Controller is unable to use the Netconf Connection Client (NCC) to establish a Netconf connection to the device. Workaround: Restart Netconf on the NorthStar server. [root@pcs-1 templates]# supervisorctl restart netconf netconf:netconf: stopped netconf:netconf: started |
SR LSP provisioning requires LSP statefull SR capability |
You must configure the following command on the Junos device through the CLI, to provision the SR LSP: set protocols pcep pce <name> spring-capability |
PCC That is Not PCEP-Enabled
The Toposerver associates the PCEP sessions with the nodes in the topology from the TED in order to make a node PCEP-enabled. This Toposerver function is hindered if the IP address used by the PCC to establish the PCEP session was not the one automatically learned by the Toposerver from the TED. For example, if a PCEP session is established using the management IP address, the Toposerver will not receive that IP address from the TED.
When the PCC successfully establishes a PCEP session, it sends a PCC_SYNC_COMPLETE message to the Toposerver. This message indicates to NorthStar that synchronization is complete. The following is a sample of the corresponding toposerver log entries, showing both the PCC_SYNC_COMPLETE message and the PCEP IP address that NorthStar might or might not recognize:
Dec  9 17:12:11.610225 fe-cluster-03 TopoServer  NSTopo::updateNode (PCCNodeEvent) ip: 172.25.155.26 pcc_ip: 172.25.155.26 evt_type: PCC_SYNC_COMPLETE
Dec  9 17:12:11.610230 fe-cluster-03 TopoServer  Adding PCEP flag to pcep_ip: 172.25.155.26 node_id: 0880.0000.0026 router_ID: 88.0.0.26 protocols: 4
Dec  9 17:12:11.610232 fe-cluster-03 TopoServer  Setting live pcep_ip: 172.25.155.26 for router_ID: 88.0.0.26
Some options for correcting the problem of an unrecognized IP address are:
Manually input the unrecognized IP address in the device profile in the NorthStar Web UI by navigating to More Options > Administration > Device Profile.
Ensure there is at least one LSP originating on the router, which will allow Toposerver to associate the PCEP session with the node in the TED database.
Once the IP address problem is resolved, and the Toposerver is able to successfully associate the PCEP session with the node in the topology, it adds the PCEP IP address to the node attributes as can be seen in the PCS log:
Dec  9 17:12:11.611392 fe-cluster-03 PCServer  [<-TopoServer] routing_key = ns_node_update_key
Dec  9 17:12:11.611394 fe-cluster-03 PCServer  [<-TopoServer] NODE UPDATE(Live): ID=0880.0000.0026 protocols=(20)ISIS2,PCEP status=UNKNOWN hostname=skynet_26 router_ID=88.0.0.26 iso=0880.0000.0026 isis_area=490001 AS=41 mgmt_ip=172.25.155.26 source=NTAD Hostname=skynet_26 pcep_ip=172.25.155.26
LSP Stuck in PENDING or PCC_PENDING State
Once nodes are correctly established as PCEP-enabled, you could start provisioning LSPs. It is possible for the LSP controller status to indicate PENDING or PCC_PENDING as seen in the Tunnels tab of the Web UI network information table (Controller Status column). This section explains how to interpret those statuses.
When an LSP is being provisioned, the PCS server computes a path that satisfies all the requirements for the LSP, and then sends a provisioning order to the PCEP server. Log messages similar to the following example appear in the PCS log while this process is taking place:
Apr Apr 25 10:06:44.798336 user-PCS PCServer  [->TopoServer] push lsp configlet, action=ADD
Apr 25 10:06:44.798341 user-PCS PCServer  {#012"lsps":[#012{"request-id":928380025,"name":"JTAC","from":"10.0.0.102",
 "to":"10.0.0.104","pcc":"172.25.158.66","bandwidth":"100000","metric":0,"local-protection":false,"type":"primary",
"association-group-id":0,"path-attributes":{"admin-group":{"exclude":0,"include-all":0, "include-any":0},"setup-priority":
7,"reservation-priority":7,"ero":[{"ipv4-address":"10.102.105.2"},{"ipv4-address":"10.105.107.2"}, {"ipv4-address":
"10.114.117.1"}]}}#012]#012}
Apr 25 10:06:44.802500 user-PCS PCServer  provisioning order sent, status = SUCCESS
Apr 25 10:06:44.802519 user-PCS PCServer  [->TopoServer] Save LSP action, id=928380025 event=Provisioning Order(ADD) sent request_id=928380025
Apr 25 10:06:44.802534 user-PCS PCServer   lsp action=ADD JTAC@10.0.0.102 path= controller_state=PENDING
The LSP controller status is PENDING at this point, meaning that the provisioning order has been sent to the PCEP server, but an acknowledgement has not yet been received. If an LSP is stuck at PENDING, it suggests that the problem lies with the PCEP server. You can log into the PCEP server and configure verbose log messages which can provide additional information of possible troubleshooting value:
pcep_cli
set log-level all
There are also a variety of show commands on the PCEP server that can display useful information. Just as with Junos OS syntax, you can enter show ? to see the show command options.
If the PCEP server successfully receives the provisioning order, it performs two actions:
It forwards the order to the PCC.
It sends an acknowledgement back to the PCS.
The PCEP server log would show an entry similar to the following example:
2016-04-25 10:06:45.196263(27897)[EVENT]: 172.25.158.66:JTAC UPD RCVD FROM PCC, ack 928380025
2016-04-25 10:06:45.196517(27897)[EVENT]: 172.25.158.66:JTAC ADD SENT TO   PCS 928380025, UP
The LSP controller status changes to PCC_PENDING, indicating that the PCEP server received the provisioning order and forwarded it on to the PCC, but the PCC has not yet responded. If an LSP is stuck at PCC_PENDING, it suggests that the problem lies with the PCC.
If the PCC receives the provisioning order successfully, it sends a response to the PCEP server, which in turn, forwards the response to the PCS. When the PCS receives this response, it clears the LSP controller status completely, indicating that the LSP is fully provisioned and is not waiting for action from the PCEP server or PCC. The operational status (Op Status column) then becomes the indicator for the condition of the tunnel.
The PCS log would show an entry similar to the following example:
Apr 25 10:06:45.203909 user-PCS PCServer [<-TopoServer] JTAC@10.0.0.102, LSP event=(0)CREATE request_id=928380025 tunnel_id=9513 lsp_id=1 report_type=ACK
LSP That is Not Active
If an LSP provisioning order is successfully sent and acknowledged, and the controller status is cleared, it is still possible that the LSP is not up and running. If the operational status of the LSP is DOWN, the PCC cannot signal the LSP. This section explores some of the possible reasons for the LSP operational status to be DOWN.
Utilization is a key concept related to LSPs that are stuck in DOWN. There are two types of utilization, and they can be different from each other at any specific time:
Live utilization—This type is used by the routers in the network to signal an LSP path. This type of utilization is learned from the TED by way of NTAD. You might see PCS log entries such as those in the following example. In particular, note the reservable bandwidth (reservable_bw) entries that advertise the RSVP utilization on the link:
Apr 25 10:10:11.475686 user-PCS PCServer  [<-TopoServer] LINK UPDATE: ID=L10.105.107.1_10.105.107.2 status=UP nodeA=0110.0000.0105 nodeZ=0110.0000.0107 protocols=(260)ISIS2,MPLS
Apr 25 10:10:11.475690 user-PCS PCServer    [A->Z] ID=L10.105.107.1_10.105.107.2 IP address=10.105.107.1 bw=10000000000 max_rsvp_bw=10000000000 te_metric=10 color=0 reservable_bw={9599699968 8599699456 7599699456 7599699456 7599699456 7599699456 7599699456 7099599360 }
Apr 25 10:10:11.475694 user-PCS PCServer    [Z->A] ID=L10.105.107.1_10.105.107.2 IP address=10.105.107.2 bw=10000000000 max_rsvp_bw=10000000000 te_metric=10 color=0 reservable_bw={10000000000 10000000000 10000000000 8999999488 7899999232 7899999232 7899999232 7899999232 }
Planned utilization—This type is used within NorthStar Controller for path computation. This utilization is learned from PCEP when the router advertises the LSP and communicates to NorthStar the LSP bandwidth and the path the LSP is to use. You might see PCS log entries such as those in the following example. In particular, note the bandwidth (bw) and record route object (RRO) entries that advertise the RSVP utilization on the link:
Apr 25 10:06:45.208021 ns-PCS PCServer  [<-TopoServer] routing_key = ns_lsp_link_key
Apr 25 10:06:45.208034 ns-PCS PCServer  [<-TopoServer] JTAC@10.0.0.102, LSP event=(2)UPDATE request_id=0 tunnel_id=9513 lsp_id=1 report_type=STATE_CHANGE
Apr 25 10:06:45.208039 ns-PCS PCServer   JTAC@10.0.0.102, lsp add/update event lsp_state=ACTIVE admin_state=UP, delegated=true
Apr 25 10:06:45.208042 ns-PCS PCServer   from=10.0.0.102 to=10.0.0.104
Apr 25 10:06:45.208046 ns-PCS PCServer   primary path
Apr 25 10:06:45.208049 ns-PCS PCServer   association.group_id=128 association_type=1
Apr 25 10:06:45.208052 ns-PCS PCServer    priority=7/7 bw=100000 metric=30
Apr 25 10:06:45.208056 ns-PCS PCServer    admin group bits exclude=0 include_any=0 include_all=0
Apr 25 10:06:45.208059 ns-PCS PCServer    PCE initiated
Apr 25 10:06:45.208062 ns-PCS PCServer    ERO=0110.0000.0102--10.102.105.2--10.105.107.2--10.114.117.1
Apr 25 10:06:45.208065 ns-PCS PCServer    RRO=0110.0000.0102--10.102.105.2--10.105.107.2--10.114.117.1
Apr 25 10:06:45.208068 ns-PCS PCServer    samepath, state changed
It is possible for the two utilizations to be different enough from each other that it causes interference with successful computation or signalling of the path. For example, if the planned utilization is higher than the live utilization, a path computation issue could arise in which the PCS cannot compute the path because it thinks there is no room for it. But because the planned utilization is higher than the actual live utilization, there may very well be room.
It’s also possible for the planned utilization to be lower than the live utilization. In that case, the PCC does not signal the path because it thinks there is no room for it.
To view utilization in the Web UI topology map, navigate to Options in the left pane of the Topology view. If you select RSVP Live Utilization, the topology map reflects the live utilization that comes from the routers. If you select RSVP Utilization, the topology map reflects the planned utilization which is computed by the NorthStar Controller based on planned properties.
A better troubleshooting tool in the Web UI is the Network Model Audit widget in the Dashboard view. The Link RSVP Utilization line item reflects whether there are any mismatches between the live and the planned utilizations. If there are, you can try executing Sync Network Model from the Web UI by navigating to Administration > System Settings, and then clicking Advanced Settings in the upper right corner of the resulting window.
The upper right corner button toggles between General Settings and Advanced Settings.
PCS Out of Sync with Toposerver
If the PCS becomes out of sync with Toposerver such that they do not agree on the state of LSPs, you must deactivate and reactivate the PCEP protocol in order to restore synchronization. Perform the following steps on the NorthStar server.
Be aware that following this procedure:
Kills the PCEP sessions for all PCCs, not just the one with which there is a problem.
Results in the loss of all user data which then needs to be repopulated.
Has an impact on a production system due to the resynchronization.
Stop the PCE server and wait 10 seconds to allow the PCC to remove all lingering LSPs.
supervisorctl stop northstar:pceserver
Restart the PCE server.
supervisorctl start northstar:pceserver
Restart Toposerver.
supervisorctl restart northstar:toposerver
Note:An alternative way to restart Toposerver is to perform a Reset Network Model from the NorthStar Controller web UI (Administration > System Settings, Advanced). See the Disappearing Changes section for more information about the Sync Network Model and Reset Network Model operations.
Disappearing Changes
Two options are available in the Web UI for synchronizing the topology with the live network. These options are only available to the system administrator, and can be accessed by first navigating to Administration > System Settings, and then clicking Advanced Settings in the upper right corner of the resulting window.
The upper right corner button toggles between General Settings and Advanced Settings.
Figure 6 shows the two options that are displayed.
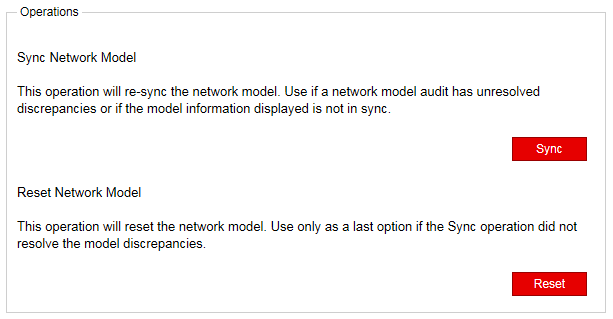
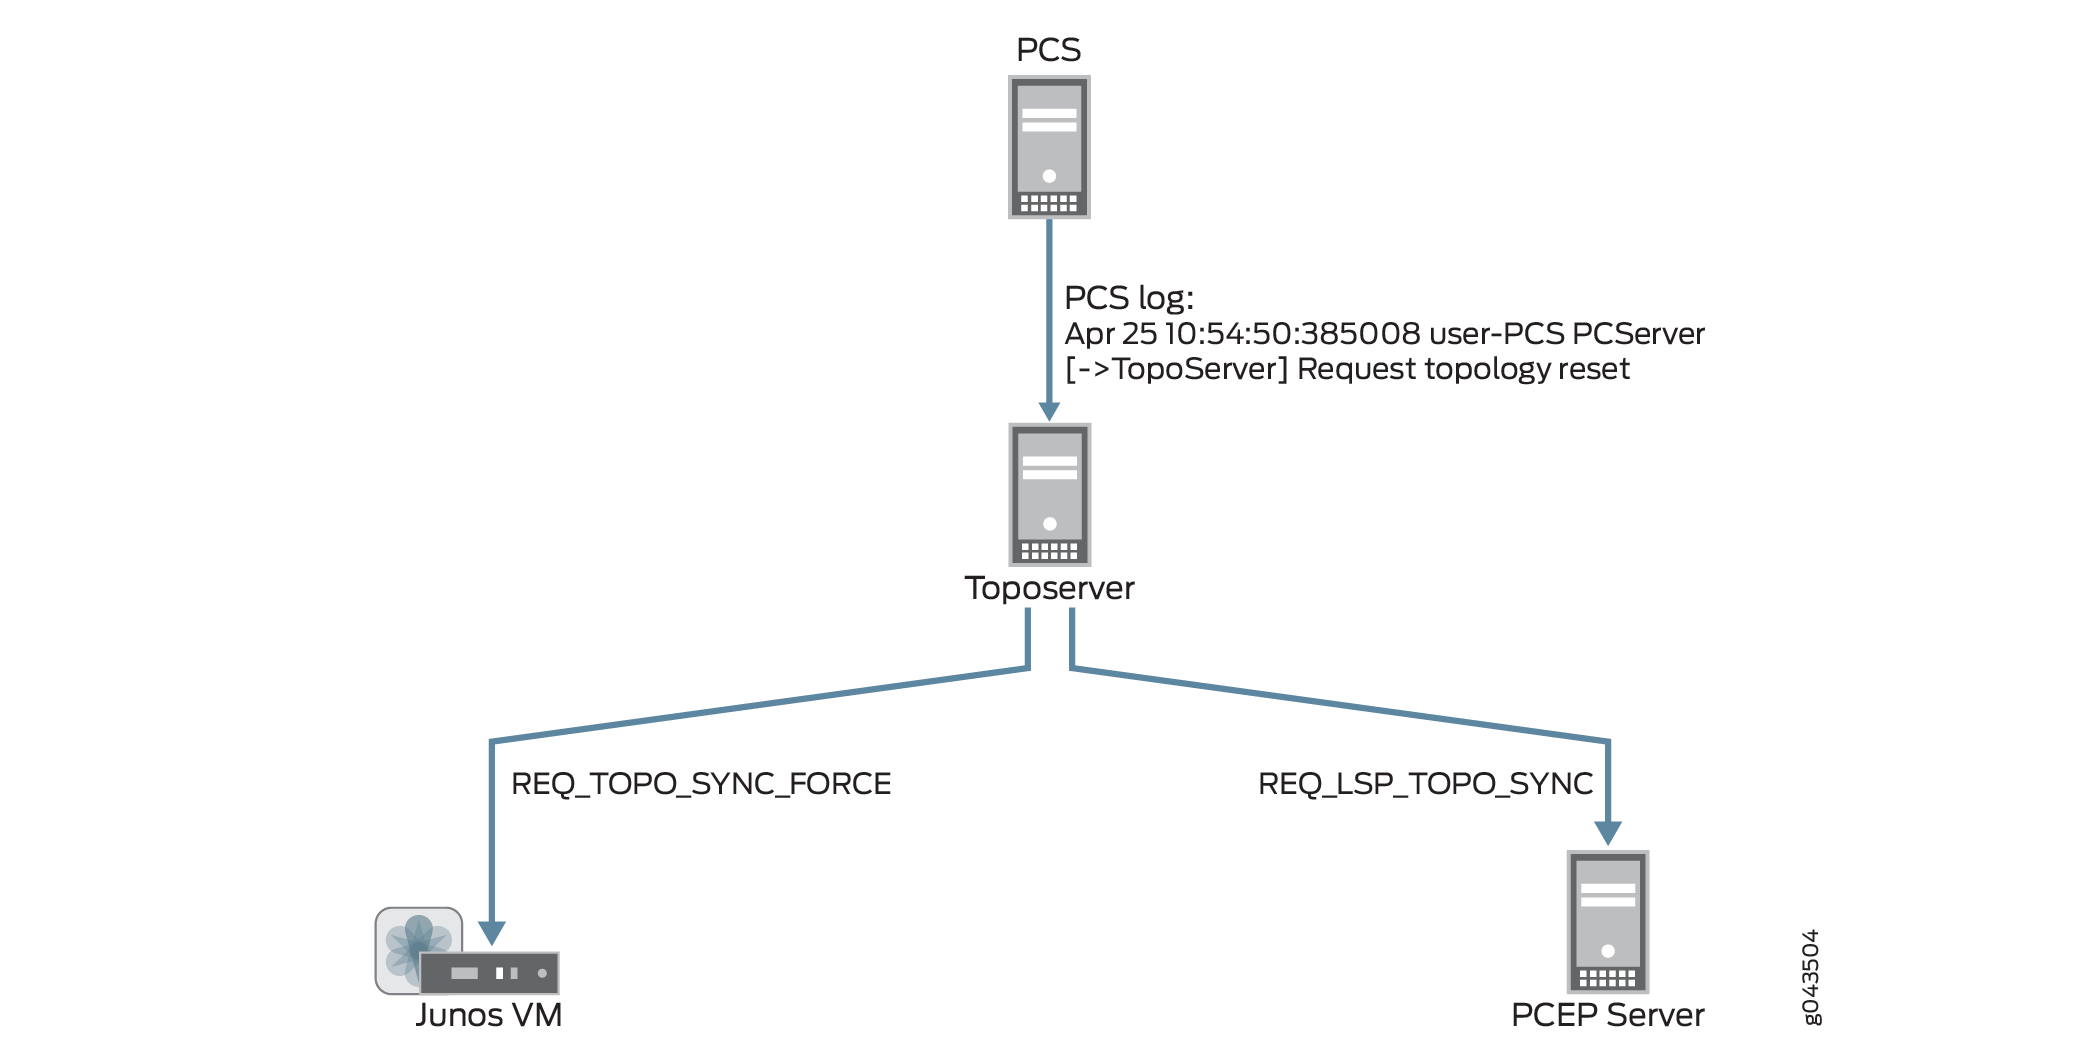
It is important to be aware that if you execute Reset Network Model in the Web UI, you will lose changes that you’ve made to the database. In a multi-user environment, one user might reset the network model without the knowledge of the other users. When a reset is requested, the request goes from the PCS server to the Toposerver, and the PCS log reflects:
Apr 25 10:54:50.385008 user-PCS PCServer [->TopoServer] Request topology reset
The Toposerver log then reflects that database elements are being removed:
Apr 25 10:54:50.386912 user-PCS TopoServer  Truncating pcs.links...
Apr 25 10:54:50.469722 user-PCS TopoServer  Truncating pcs.nodes...
Apr 25 10:54:50.517501 user-PCS TopoServer  Truncating pcs.lsps...
Apr 25 10:54:50.753705 user-PCS TopoServer  Truncating pcs.interfaces...
Apr 25 10:54:50.806737 user-PCS TopoServer  Truncating pcs.facilities...
The Toposerver then requests a synchronization with both the Junos VM to retrieve the topology nodes and links, and with the PCEP server to retrieve the LSPs. In this way, the Toposerver relearns the topology, but any user updates are missing. Figure 7 illustrates the flow from the topology reset request to the request for synchronization with the Junos VM and the PCEP Server.
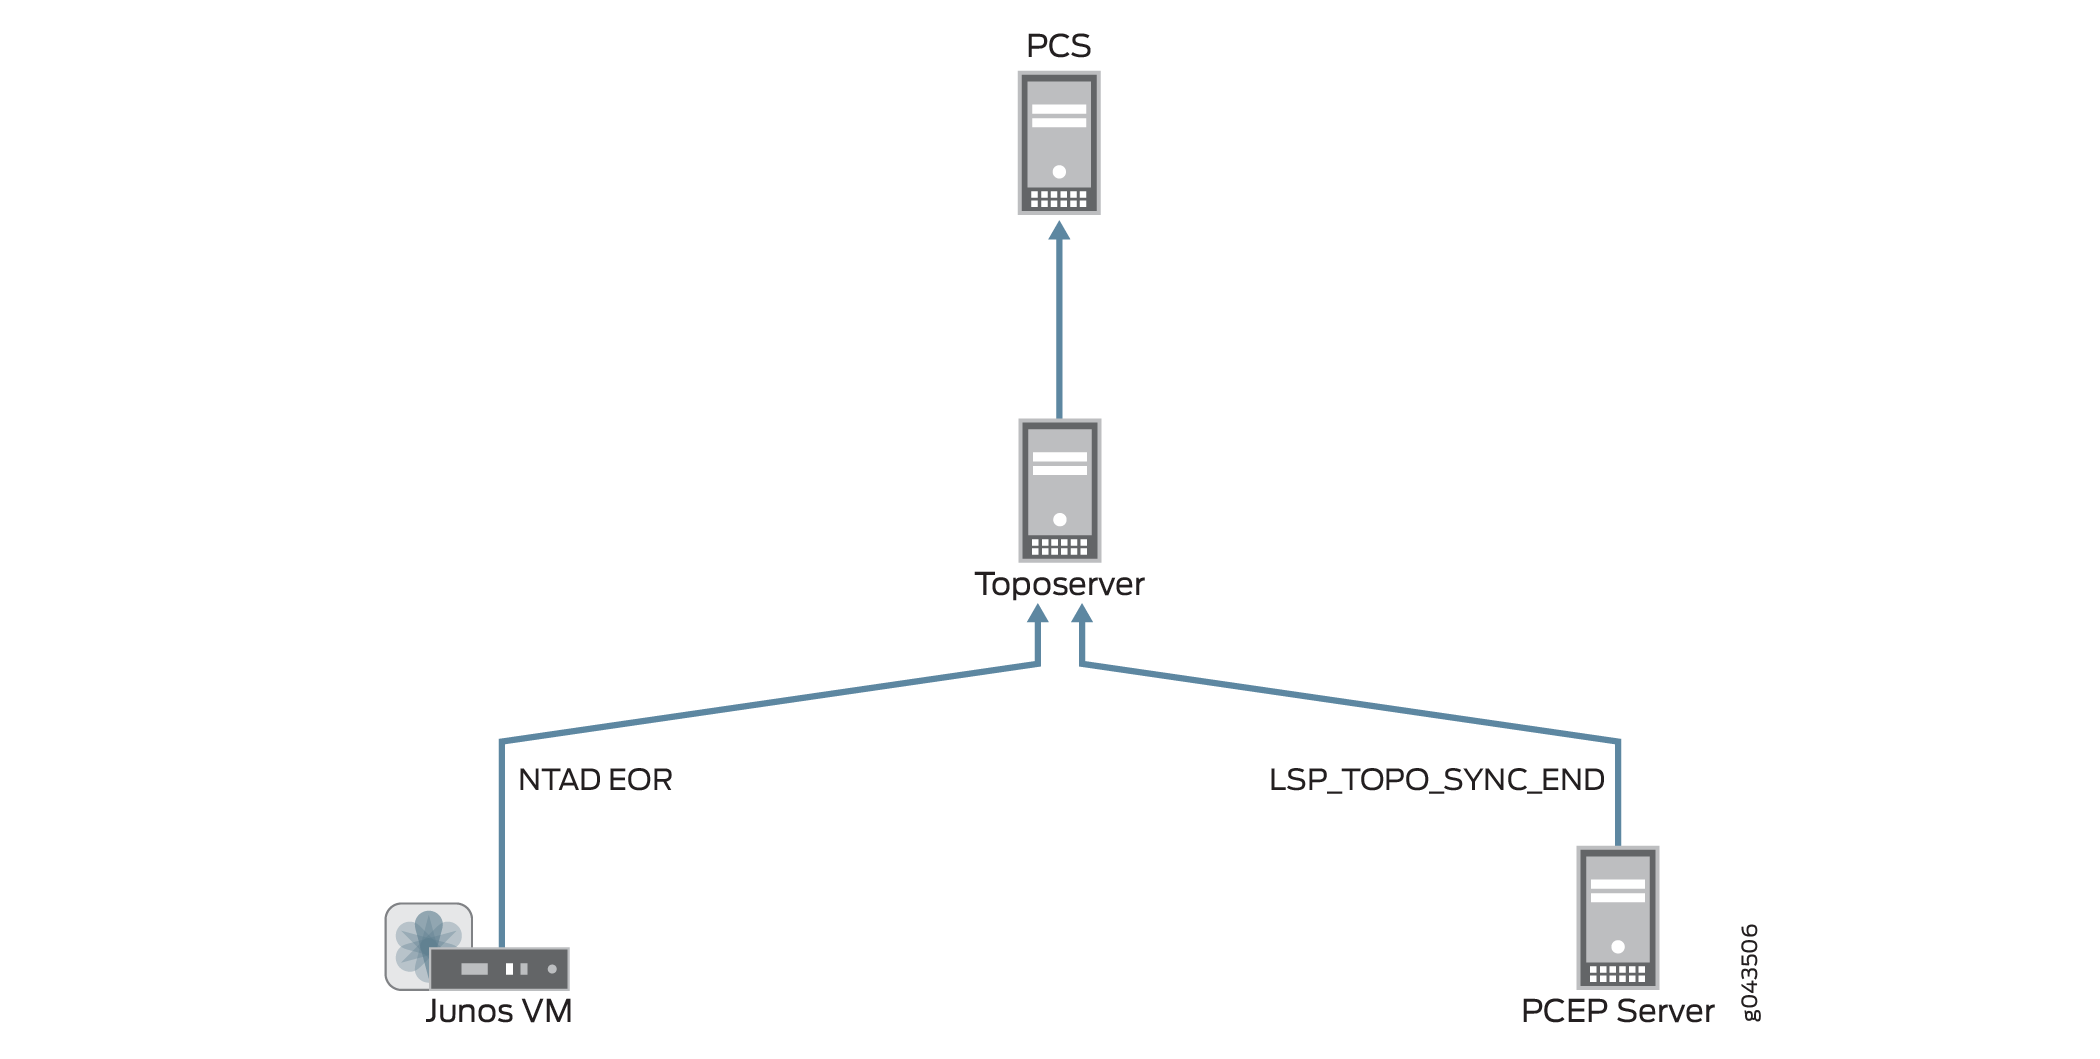
Upon receipt of the synchronization requests, Junos VM and the PCEP server return topology updates that reflect the current live network. The PCS log shows this information being added to the database:
Apr 25 10:54:52.237882 user-PCS PCServer  [<-TopoServer] Update Topology
Apr 25 10:54:52.237894 user-PCS PCServer  [<-TopoServer] Update Topology Persisted Nodes (0)
Apr 25 10:54:52.238957 user-PCS PCServer  [<-TopoServer] Update Topology Live Nodes (7)
Apr 25 10:54:52.242336 user-PCS PCServer  [<-TopoServer] Update Topology Persisted Links (0)
Apr 25 10:54:52.242372 user-PCS PCServer  [<-TopoServer] Update Topology live Links (10)
Apr 25 10:54:52.242556 user-PCS PCServer  [<-TopoServer] Update Topology Persisted Facilities (1)
Apr 25 10:54:52.242674 user-PCS PCServer  [<-TopoServer] Update Topology Persisted LSPs (0)
Apr 25 10:54:52.279716 user-PCS PCServer  [<-TopoServer] Update Topology Live LSPs (47)
Apr 25 10:54:52.279765 user-PCS PCServer  [<-TopoServer] Update Topology Finished
Figure 8 illustrates the return of topology updates from the Junos VM and the PCEP Server to the Toposerver and the PCS.
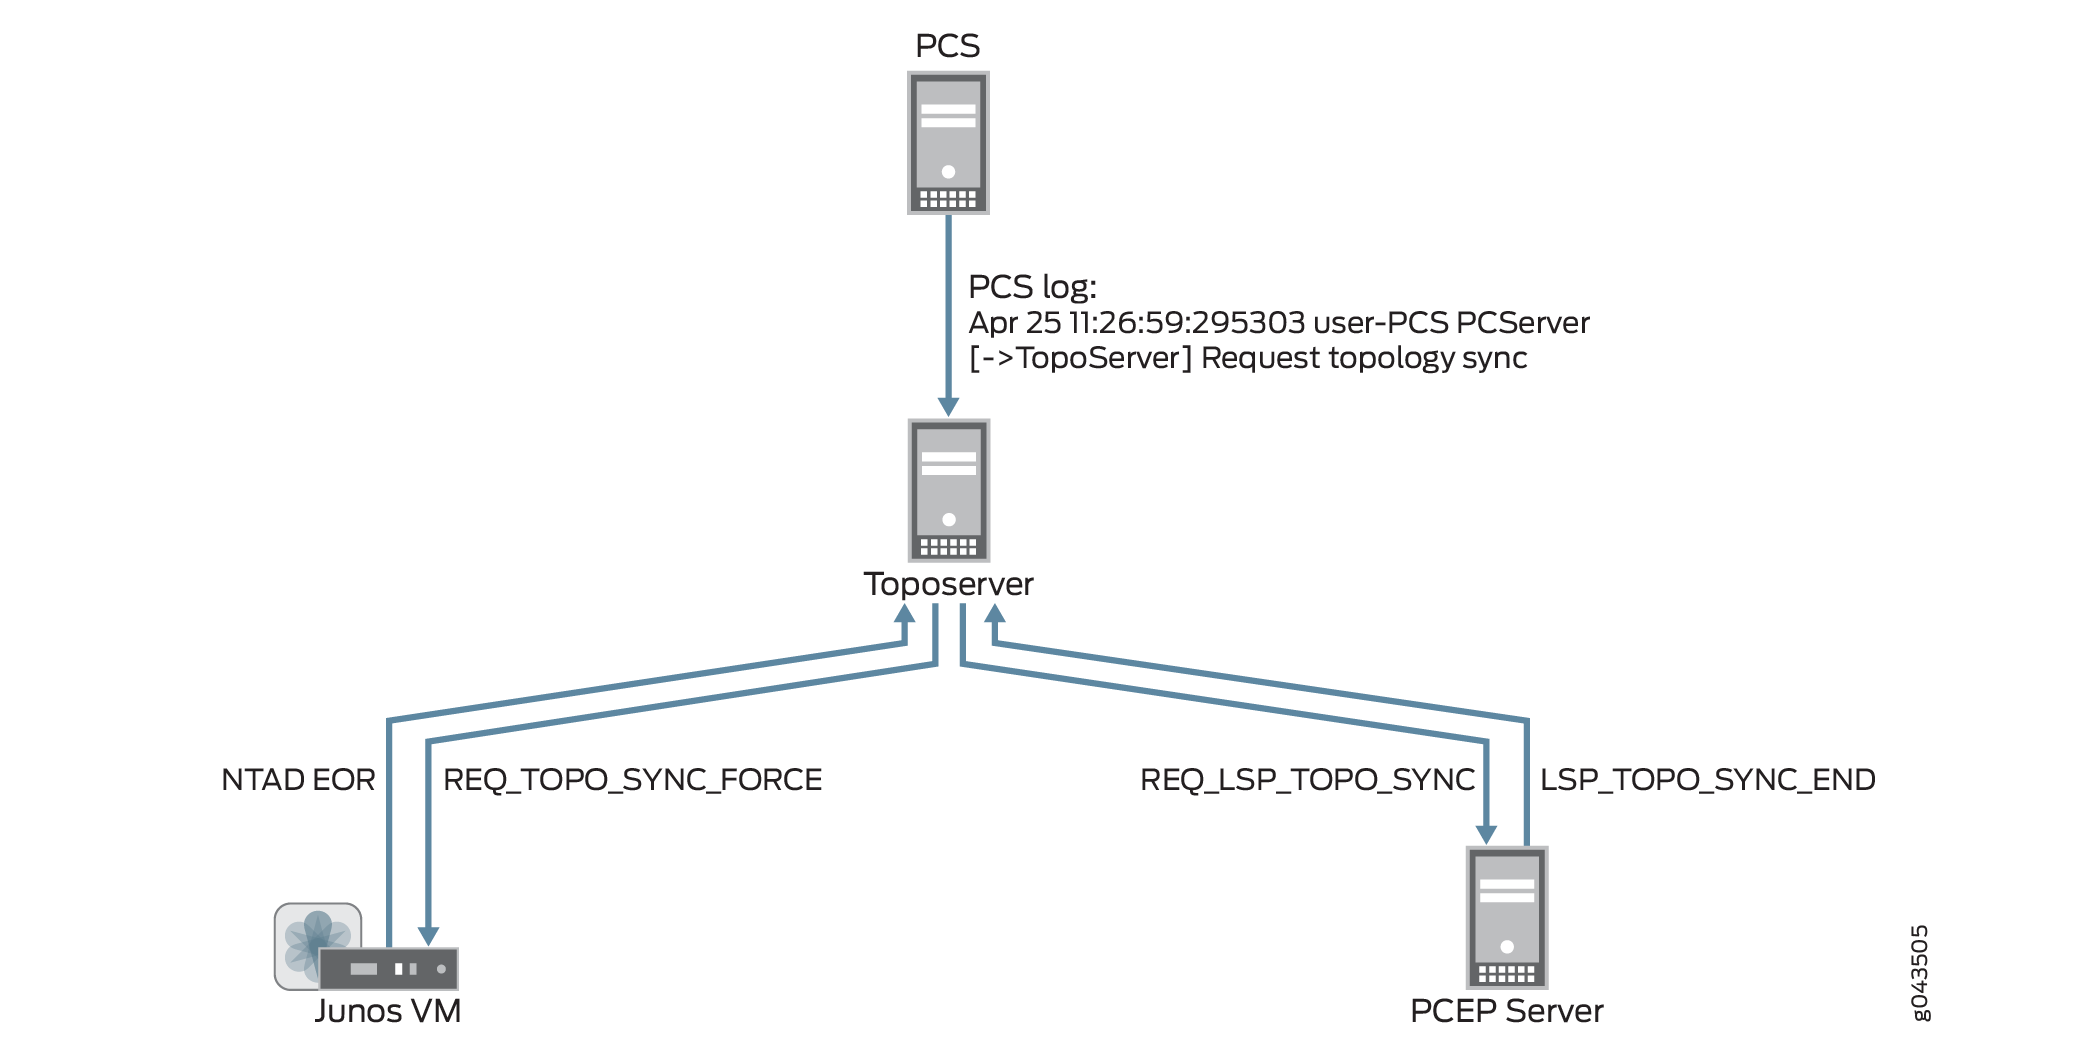
You should use the Reset Network Model when you want to start over from scratch with your topology, but if you don’t want to lose user planning data when synchronizing with the live network, execute the Sync Network Model operation instead. With this operation, the PCS still requests a topology synchronization, but the Toposerver does not delete the existing elements. Figure 9 illustrates the flow from the PCS to the Junos VM and PCEP server, and the updates coming back to the Toposerver.
Investigating Client Side Issues
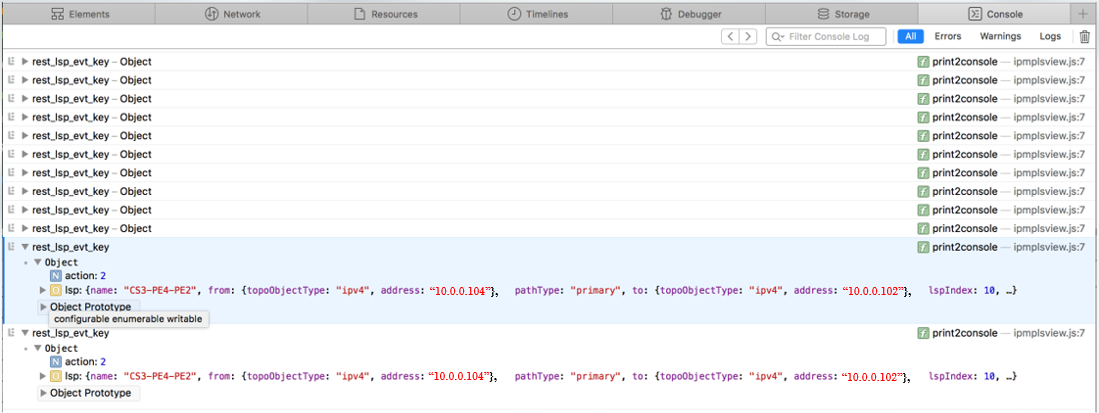
If you are looking for the source of a problem, and you cannot find it on the server side of the system, there is a debugging flag that can help you find it on the client side. The flag enables detailed messages on the web browser console about what has been exchanged between the server and the client. For example, you might notice that an update is not reflected in the Web UI. Using these detailed messages, you can identify possible miscommunication between the server and the client such as the server not actually sending the update, for example.
To enable this debug flag, modify the URL you use to launch the Web UI as follows:
https://server_address:8443/client/app.html?debug=true
If you are already in the Web UI, it is not necessary to log
out; simply add ?debug=true to the URL
and press Enter. The UI reloads.
Figure 10 shows an example of the web browser console with detailed debugging messages.
Accessing the console varies by browser. Figure 11 shows an example: accessing the console on Google Chrome.
Incomplete Results of the Bandwidth Sizing Scheduled Task
If execution of the bandwidth sizing scheduled task does not result in publishing statistics for all the bandwidth sizing-enabled LSPs, check to see if the traffic statistics are being collected for all the bandwidth sizing-enabled LSPs for the scheduled duration. If traffic statistics are not available, the bandwidth statistics for those LSPs cannot be resized.
You can use the NorthStar Collector web UI to determine whether traffic statistics are being collected:
Open the Tunnel tab in the network information table.
Select the LSPs that have not been resized.
Right-click and select View LSP Traffic.
Click custom in the upper left corner, provide the schedule duration, and click Submit.
Troubleshooting NorthStar Integration with HealthBot
If update device to HealthBot is failing in NorthStar, first check to see if there are errors in the NorthStar web application server logs:
[root@ns1-site1 ~]# tail -f /opt/northstar/logs/web_app.msg

2019 Oct 15 02:46:49.824 - info: Request:  User:admin (full):http:GET:127.0.0.1:/NorthStar/API/v1/tenant/1/RouterProfiles/vendorList
2019 Oct 15 02:46:52.165 - info: Request:  User:admin (full):http:GET:127.0.0.1:/NorthStar/API/v1/tenant/1/RouterProfiles/liveNetwork
2019 Oct 15 02:47:10.466 - info: Request:  User:admin (full):http:POST:127.0.0.1:/NorthStar/API/v2/tenant/1/RouterProfiles/healthbot/updateDevices
req: {}
2019 Oct 15 02:47:17.084 - debug: Devices updated, Healthbot response body = ""
2019 Oct 15 02:47:17.512 - info: Request:  User:admin (full):http:POST:127.0.0.1:/NorthStar/API/v2/tenant/1/RouterProfiles/healthbot/updateDeviceGroup
req: {"devices":["vmx104","vmx101","vmx107","vmx103","vmx106","vmx105","vmx102"]}
2019 Oct 15 02:47:18.453 - debug: Device Group updated, Healthbot response body = ""
2019 Oct 15 02:47:18.860 - info: Request:  User:admin (full):http:POST:127.0.0.1:/NorthStar/API/v2/tenant/1/RouterProfiles/healthbot/commitConfigs
2019 Oct 15 02:47:18.935 - debug: Commit completed, Healthbot response body = "{\n  \"detail\": \"Committing the configuration.\",\n  \"status\": 202,\n  \"url\": \"/api/v1/configuration/jobs/?job_id=c6be7387-bfbf-45e4-97c8-993f27bcbe09\"\n}\n"
The HealthBot API server logs might also provide helpful information if update device to HealthBot is failing:
root@healthbot-vm1:~# healthbot logs --device-group healthbot -s api_server
docker logs 1557243a5b 2>&1 | vi -
Vim: Reading from stdin...
To determine if RPM probe data and LDP demands statistics collection is working, access the IAgent container logs. IAgent is used for RPM data (link latency) and LDP demands statistics collection.
root@healthbot-vm1:~# docker ps | grep iagent | grep northstar
3492c1f3774f        healthbot_iagent:2.1.0-beta-custom       "/entrypoint.sh salt…"   23 hours ago        Up 23 hours                                                                                                                                  device-group-northstar_device-group-northstar-iagent_1

root@healthbot-vm1:~# docker exec -it 7382325c375f  bash

root@3492c1f3774f:/# tail -f /tmp/inter-packet-export.log
2019-10-15 07:19:15,329 inter-packet.ns_link_latency Aggregates sent for 4 objects for node=vmx106

2019-10-15 07:19:24,546 inter-packet.ns_demand aggregates sent for 6 objects for node=vmx102
2019-10-15 07:19:27,522 inter-packet.ns_demand aggregates sent for 6 objects for node=vmx101
2019-10-15 07:19:33,788 inter-packet.ns_demand aggregates sent for 6 objects for node=vmx105
2019-10-15 07:19:38,110 inter-packet.ns_demand aggregates sent for 6 objects for node=vmx104
2019-10-15 07:19:39,251 inter-packet.ns_demand aggregates sent for 6 objects for node=vmx103
2019-10-15 07:20:04,654 inter-packet.ns_link_latency Aggregates sent for 2 objects for node=vmx104

2019-10-15 07:20:05,878 inter-packet.ns_link_latency Aggregates sent for 4 objects for node=vmx105

2019-10-15 07:20:06,535 inter-packet.ns_link_latency Aggregates sent for 1 objects for node=vmx103

2019-10-15 07:20:07,537 inter-packet.ns_link_latency Aggregates sent for 3 objects for node=vmx101

2019-10-15 07:20:09,479 inter-packet.ns_link_latency Aggregates sent for 4 objects for node=vmx102

2019-10-15 07:20:15,332 inter-packet.ns_link_latency Aggregates sent for 4 objects for node=vmx106

2019-10-15 07:21:04,657 inter-packet.ns_link_latency Aggregates sent for 2 objects for node=vmx104

2019-10-15 07:21:05,881 inter-packet.ns_link_latency Aggregates sent for 4 objects for node=vmx105

2019-10-15 07:21:06,538 inter-packet.ns_link_latency Aggregates sent for 1 objects for node=vmx103

2019-10-15 07:21:07,540 inter-packet.ns_link_latency Aggregates sent for 3 objects for node=vmx101

2019-10-15 07:21:09,484 inter-packet.ns_link_latency Aggregates sent for 4 objects for node=vm
To determine if JTI LSP and interface statistics data collection is working, access the fluentd container logs. Native GBP is used for JTI data collection.
root@healthbot-vm1:~# docker ps | grep fluentd | grep northstar
5fa268d0410b        healthbot_fluentd:2.1.0-beta-custom      "/fluentd/etc/startu…"   20 hours ago        Up 20 hours         5140/tcp, 0.0.0.0:4000->4000/tcp, 0.0.0.0:4000->4000/udp, 24224/tcp                                                      device-group-northstar_device-group-northstar-fluentd_1

root@healthbot-vm1:~# docker exec -it 5fa268d0410b  bash

root@5fa268d0410b:/# tail -f /tmp/inter-packet-export.log
2019-10-15 06:00:01,241 inter-packet.ns_interface_traffic aggregates sent for 24 objects for node=vmx105
2019-10-15 06:01:01,245 inter-packet.ns_interface_traffic aggregates sent for 24 objects for node=vmx105
2019-10-15 06:02:01,248 inter-packet.ns_interface_traffic aggregates sent for 24 objects for node=vmx105
2019-10-15 06:03:01,255 inter-packet.ns_interface_traffic aggregates sent for 24 objects for node=vmx105
2019-10-15 06:04:01,259 inter-packet.ns_interface_traffic aggregates sent for 24 objects for node=vmx105
2019-10-15 06:05:01,265 inter-packet.ns_interface_traffic aggregates sent for 24 objects for node=vmx105
2019-10-15 06:06:01,269 inter-packet.ns_interface_traffic aggregates sent for 24 objects for node=vmx105
2019-10-15 06:07:01,274 inter-packet.ns_interface_traffic aggregates sent for 24 objects for node=vmx105
2019-10-15 06:08:01,279 inter-packet.ns_interface_traffic aggregates sent for 24 objects for node=vmx105
2019-10-15 06:09:01,285 inter-packet.ns_interface_traffic aggregates sent for 24 objects for node=vmx105
To determine if statistics data is being notified from the HealthBot server to the PCS, access the PCS logs to see live statistics notification information:
[root@ns1-site1-q-pod21 ~]# tail -f /opt/northstar/logs/pcs.log
2019 Oct 15 00:09:19.221768 ns1-site1-q-pod21 PCServer  [NorthStar][PCServer][Traffic] msg=0x00005002  ge-0/0/5.3@vmx102 out=0 in=-1
2019 Oct 15 00:09:19.221783 ns1-site1-q-pod21 PCServer  [NorthStar][PCServer][Traffic] msg=0x00005002  ge-0/0/1.0@vmx102 out=0 in=-1
2019 Oct 15 00:09:19.221798 ns1-site1-q-pod21 PCServer  [NorthStar][PCServer][Traffic] msg=0x00005002  ge-0/0/5.200@vmx102 out=0 in=-1
2019 Oct 15 00:09:19.221812 ns1-site1-q-pod21 PCServer  [NorthStar][PCServer][Traffic] msg=0x00005002  ge-0/0/5.301@vmx102 out=0 in=-1
2019 Oct 15 00:09:19.880395 ns1-site1-q-pod21 PCServer  [NorthStar][PCServer][<-AMQP] msg=0x00004018 exchange=controller.wan.stats routing_key=ns_tunnel_traffic
2019 Oct 15 00:09:19.880456 ns1-site1-q-pod21 PCServer  [NorthStar][PCServer][Traffic] msg=0x00005004  test1_102_105-1@vmx102  3836219
2019 Oct 15 00:09:19.880463 ns1-site1-q-pod21 PCServer  [NorthStar][PCServer][Traffic] msg=0x00005004  rsvp-102-105@vmx102  0
2019 Oct 15 00:09:19.880469 ns1-site1-q-pod21 PCServer  [NorthStar][PCServer][Traffic] msg=0x00005004  Silver-102-101@vmx102  1041649
2019 Oct 15 00:09:19.880479 ns1-site1-q-pod21 PCServer  [NorthStar][PCServer][Traffic] msg=0x00005004  Silver-102-104@vmx102  3390530
2019 Oct 15 00:09:19.880483 ns1-site1-q-pod21 PCServer  [NorthStar][PCServer][Traffic] msg=0x00005004  Silver-102-103@vmx102  4261408

2019 Oct 15 00:09:26.795447 ns1-site1-q-pod21 PCServer  [NorthStar][PCServer][<-AMQP] msg=0x00004018 exchange=controller.wan.stats routing_key=ns_link_latency
2019 Oct 15 00:09:26.795453 ns1-site1-q-pod21 PCServer  [NorthStar][PCServer][Latency] msg=0x00007002  ge-0/1/8.0@vmx103 20.00 ms, packet_loss=0.00%
2019 Oct 15 00:09:26.795462 ns1-site1-q-pod21 PCServer  [NorthStar][PCServer][Latency] msg=0x00007002  ge-0/0/6.0@vmx101 4.00 ms, packet_loss=0.00%
2019 Oct 15 00:09:26.795471 ns1-site1-q-pod21 PCServer  [NorthStar][PCServer][Latency] msg=0x00007002  ge-0/0/5.0@vmx101 3.00 ms, packet_loss=0.00%
2019 Oct 15 00:09:26.795473 ns1-site1-q-pod21 PCServer  [NorthStar][PCServer][Latency] msg=0x00007002  ge-0/1/1.0@vmx101 19.00 ms, packet_loss=0.00%
2019 Oct 15 00:09:26.795476 ns1-site1-q-pod21 PCServer  [NorthStar][PCServer][Latency] msg=0x00007002  ge-0/1/9.0@vmx104 10.00 ms, packet_loss=0.00%
2019 Oct 15 00:09:26.795479 ns1-site1-q-pod21 PCServer  [NorthStar][PCServer][Latency] msg=0x00007002  ge-0/1/7.0@vmx104 0.00 ms, packet_loss=0.00%


2019 Oct 15 00:09:27.710072 ns1-site1-q-pod21 PCServer  [NorthStar][PCServer][<-AMQP] msg=0x00004018 exchange=controller.wan.stats routing_key=ns_demand
2019 Oct 15 00:09:27.710264 ns1-site1-q-pod21 PCServer  [Debug][PCServer] node:vmx102 prefix:10.0.0.101/32 bit_rate:0 demand_name=vmx102_10.0.0.101/32 to=10.0.0.101/32 SNMP_ifIndex:0 next_hope=
2019 Oct 15 00:09:27.710599 ns1-site1-q-pod21 PCServer  [NorthStar][PCServer][->pcs_tunnel_event] msg=0x00004002 LSP action, UPDATE id=3718607015 event=demand update
2019 Oct 15 00:09:27.710667 ns1-site1-q-pod21 PCServer  [NorthStar][PCServer][tunnelEvent] msg=0x00004027 LSP action, UPDATE id=3718607015 event=demand update
2019 Oct 15 00:09:27.710697 ns1-site1-q-pod21 PCServer  [NorthStar][PCServer][tunnelEvent] msg=0x0000400a   vmx102_10.0.0.101/32@10.0.0.102 pathname=10.0.0.101 to=10.0.0.101 bw=0 pri=7 pre=7 type=R,A2Z,PATH(10.0.0.101) path= op_state=ACTIVE ns_lsp_id =42 demand=true prefix=10.0.0.101/32
2019 Oct 15 00:09:27.710724 ns1-site1-q-pod21 PCServer  [Debug][PCServer] Redis Obj Save: Topology 1 OBJ: ns:1:pcs_lsp:id:int:obj 42 {buf} index:ns:1:pcs_lsp:indexes id_str:
2019 Oct 15 00:09:27.711440 ns1-site1-q-pod21 PCServer  [Debug][PCServer] Redis Obj Save: Done
2019 Oct 15 00:09:27.711450 ns1-site1-q-pod21 PCServer  [Debug][PCServer] node:vmx102 prefix:10.0.0.105/32 bit_rate:0 demand_name=vmx102_10.0.0.105/32 to=10.0.0.105/32 SNMP_ifIndex:0 next_hope=
2019 Oct 15 00:09:27.711454 ns1-site1-q-pod21 PCServer  [NorthStar][PCServer][->pcs_tunnel_event] msg=0x00004002 LSP action, UPDATE id=3718607015 event=demand update
2019 Oct 15 00:09:27.711457 ns1-site1-q-pod21 PCServer  [NorthStar][PCServer][tunnelEvent] msg=0x00004027 LSP action, UPDATE id=3718607015 event=demand update
2019 Oct 15 00:09:27.711461 ns1-site1-q-pod21 PCServer  [NorthStar][PCServer][tunnelEvent] msg=0x0000400a   vmx102_10.0.0.105/32@10.0.0.102 pathname=10.0.0.105 to=10.0.0.105 bw=0 pri=7 pre=7 type=R,A2Z,PATH(10.0.0.105) path= op_state=ACTIVE ns_lsp_id =44 demand=true prefix=10.0.0.105/32
2019 Oct 15 00:09:27.711464 ns1-site1-q-pod21 PCServer  [Debug][PCServer] Redis Obj Save: Topology 1 OBJ: ns:1:pcs_lsp:id:int:obj 44 {buf} index:ns:1:pcs_lsp:indexes id_str:
2019 Oct 15 00:09:27.712010 ns1-site1-q-pod21 PCServer  [Debug][PCServer] Redis Obj Save: Done
2019 Oct 15 00:09:27.712033 ns1-site1-q-pod21 PCServer  [Debug][PCServer] node:vmx102 prefix:10.0.0.103/32 bit_rate:0 demand_name=vmx102_10.0.0.103/32 to=10.0.0.103/32 SNMP_ifIndex:0 next_hope=
2019 Oct 15 00:09:27.712039 ns1-site1-q-pod21 PCServer  [NorthStar][PCServer][->pcs_tunnel_event] msg=0x00004002 LSP action, UPDATE id=3718607015 event=demand update
2019 Oct 15 00:09:27.712042 ns1-site1-q-pod21 PCServer  [NorthStar][PCServer][tunnelEvent] msg=0x00004027 LSP action, UPDATE id=3718607015 event=demand update
2019 Oct 15 00:09:27.712048 ns1-site1-q-pod21 PCServer  [NorthStar][PCServer][tunnelEvent] msg=0x0000400a   vmx102_10.0.0.103/32@10.0.0.102 pathname=10.0.0.103 to=10.0.0.103 bw=0 pri=7 pre=7 type=R,A2Z,PATH(10.0.0.103) path= op_state=ACTIVE ns_lsp_id =48 demand=true prefix=10.0.0.103/32
2019 Oct 15 00:09:27.712808 ns1-site1-q-pod21 PCServer  [Debug][PCServer] Redis Obj Save: Topology 1 OBJ: ns:1:pcs_lsp:id:int:obj 48 {buf} index:ns:1:pcs_lsp:indexes id_str:
2019 Oct 15 00:09:27.713209 ns1-site1-q-pod21 PCServer  [Debug][PCServer] Redis Obj Save: Done
2019 Oct 15 00:09:27.713219 ns1-site1-q-pod21 PCServer  [Debug][PCServer] node:vmx102 prefix:10.0.0.104/32 bit_rate:0 demand_name=vmx102_10.0.0.104/32 to=10.0.0.104/32 SNMP_ifIndex:0 next_hope=
Collecting NorthStar Controller Debug Files
If you are unable to resolve a problem with the NorthStar Controller, we recommend that you forward the debug files generated by the NorthStar Controller debugging utility to JTAC for evaluation. Currently all debug files are located in subdirectories under the u/wandl/tmp directory.
To collect debug files, log in to the NorthStar Controller CLI, and execute the command u/wandl/bin/system-diagnostic.sh filename.
The output is generated and is available from the /tmp directory in the filename.tbz2 debug file.
Remote Syslog
Most of NorthStar processes use rsyslog which is defined in /etc/rsyslog.conf. For a detailed information about using rsyslog, refer to http://www.rsyslog.com/doc for the specific rsyslog version running on your Linux system.
Increasing the Scale of SNMP Collection
To increase the scale of SNMP collection within a polling interval of 5 minutes, perform the following tasks:
By using a text editing tool like vi, open the
supervisord_snmp_slave.conffile for editing.The configuration file opens.
vi opt/northstar/data/supervisord/supervisord_snmp_slave.conf
Add the following command to increase the number of threads from 100 to 200:
/opt/northstar/thirdparty/python3/bin/celery -A collector.celery -Q netsnmp -n worker2@%%n worker -P threads -c 200--loglevel=info
Add more workers (for example, worker3) by duplicating the preceding worker:
[program:worker3]
/opt/northstar/thirdparty/python3/bin/celery -A collector.celery -Q netsnmp -n worker3@%%n worker -P threads -c 200--loglevel=info
process_name=%(program_name)s
numprocs=1
;directory=/tmp
;umask=022
priority=999
autostart=true
autorestart=true
startsecs=10
startretries=3
exitcodes=0,2
stopsignal=TERM
stopwaitsecs=10
user=pcs
stopasgroup=true
killasgroup=true
redirect_stderr=true
stopasgroup=true
stdout_logfile=/opt/northstar/logs/celery_worker3.msg
stdout_logfile_maxbytes=10MB
stdout_logfile_backups=10
stdout_capture_maxbytes=10MB
stderr_logfile=/opt/northstar/logs/celery_worker3.err
stderr_logfile_maxbytes=10MB
stderr_logfile_backups=10
stderr_capture_maxbytes=10MB
environment=PYTHONPATH="/opt/northstar/snmp-collector",LD_LIBRARY_PATH="/opt/northstar/lib"
;environment=A="1",B="2"
;serverurl=AUTO
Add the workers in the group statement:
Best Practice:The number of workers that you can add should be less than or equal to the number of cores in the CPU.
[group:collector]
programs=worker1,worker2,worker3
Restart the
collector:* groupin the supervisord:supervisorctl reread supervisorctl update
View the supervisorctl status of worker1, worker2, and worker3 to confirm that they are up and running:
supervisorctl status
Ensure that you see a few worker1 processes in the output but only one parent process each for worker2 and worker3:
ps -ef | grep celery
To increase the number of threads for higher scalability, perform the following tasks:
By using a text editing tool like vi, open the
data_gateway.pyfile for editing.The configuration file opens.
vi /opt/northstar/snmp-collector/collector/data_gateway.py
Increase the number of threads in the pool from 10 to 20:
pool_size = 20
Stop the
collector_main:data_gatewayprocess and restart the process:supervisorctl stop collector_main:data_gateway supervisorctl restart collector_main:data_gateway
To increase the throughput for higher scalability, perform the following tasks:
By using a text editing tool like vi, open the
es_publisher.cfgfile for editing.The configuration file opens.
vi /opt/northstar/data/es_publisher/es_publisher.cfg
Configure the following parameters:
polling_interval=5
batch_size=5000
pool_size=20
Note:The maximum number of records to be sent in a single operation to the ElasticSearch database (batch_size) is 5000, while the maximum number of threads (in a thread pool) that can be run to collect SNMP statistics (pool_size) is 20.
To collect data from more number of router interfaces per poll, perform the following tasks:
Navigate to the Device Profile (Administration > Device Profile) page in the NorthStar Controller GUI.
In the Device List, select a router and click Modify.
The Modify Device(s) page appears.
In the Name column of the User-defined Properties tab, specify the name of the property as bulk_size. In the Value column, configure the bulk size as 100.
Bulk size indicates the number of interfaces collected each time the network is polled.
Click Modify.
You are redirected to the Device Profile page, where a confirmation message appears, indicating that the changes are saved.