Help us improve your experience.

Let us know what you think.

Do you have time for a two-minute survey?


VPN Monitoring and Diagnostics

The VPN Module together with the Online Module provides you with VPN monitoring and diagnostics capabilities for a live router network.

Note:

This feature requires the Online Module.

This feature requires the Online Module. First you would need to perform network data collection using the Task Manager . Upon completion of network configuration collection, the program constructs the network model that includes all the configured VPNs in the network.

For a PE router, you may run “show” commands (accessible via the Run CLI... menu by right-clicking on a node in the topology map). Click the arrow next to the Commands list to select a VPN category to view the available CLI commands for VPNs.

To observe the network traffic condition (e.g. between PE and CE), periodic sampling of interface traffic statistics is performed by the Task Manager. The collected interface data can then be accessed in the form or reports and charts. The following figure shows a PE->CE interface traffic chart for router SFO.
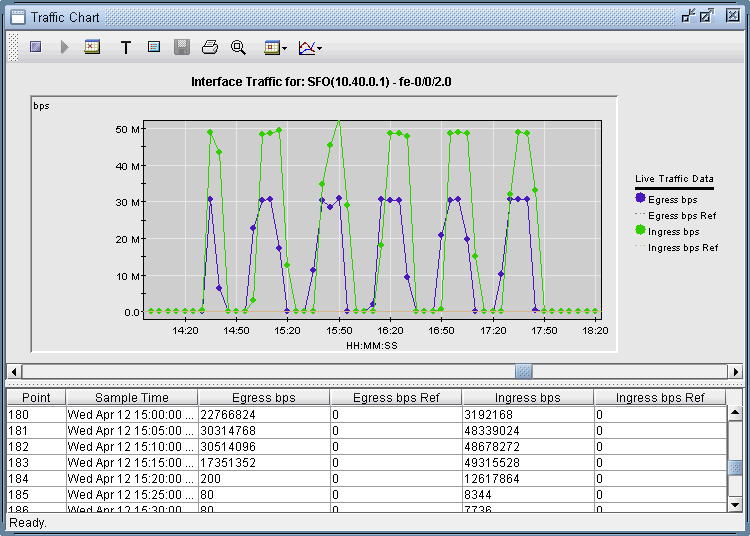
Figure 1: PE->CE Interface Traffic Chart (For PE Router SFO)Network traffic monitoring chart showing purple line for egress and green line for ingress traffic over time in Mbps.

In the Report Manager, a VPN Interface Traffic report is available under Network Reports > VPN that lets you see the interface traffic for each node of each VPN, as shown in the following figure.
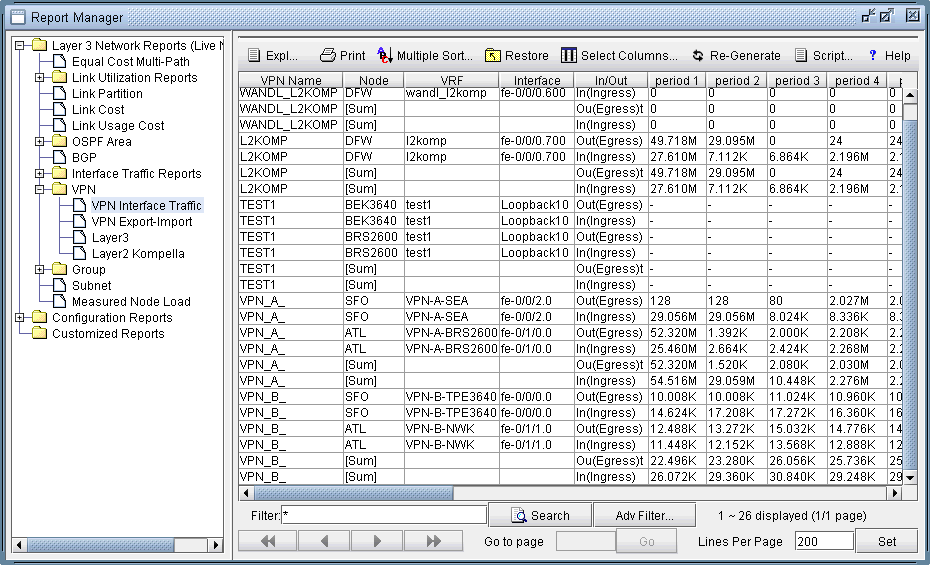
Figure 2: VPN Interface Traffic ReportReport Manager interface for network management with a menu of report categories on the left and a VPN Interface Traffic report table on the right. The table lists VPN names, nodes, VRFs, interfaces, and traffic data for four periods with options for exporting, printing, sorting, and filtering.

To verify connectivity and to measure delay and loss, you can also perform VPN diagnostics (e.g., CE-CE Ping and Traceroute) as shown in the following figures.
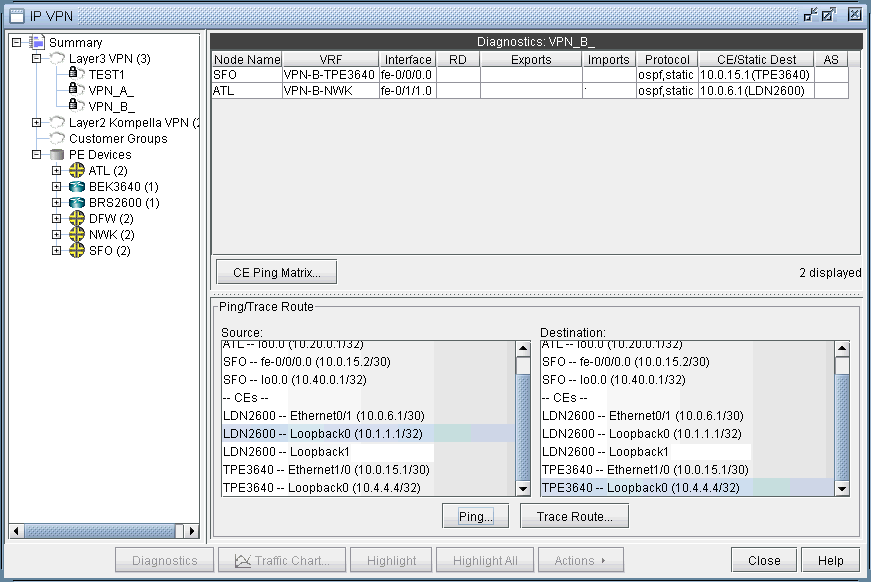
Figure 3: Ping/trace Route Between Routers from the IP VPN WindowNetwork management tool screenshot for IP VPNs showing navigation tree with VPN categories and devices, diagnostics for VPN_B with node names, VRF, interfaces, routing protocols, and ping/trace route options for connectivity testing.

From the right-click menu of the VPNView topology, you can many functions (e.g. path tracing, running CLI commands, and connect to device).

With Java Web Start installed, you may also perform VPN monitoring and diagnostic functions from a web browser, as well as to access VPN-related reports and charts. The following figures are meant illustrate just some of the web features available.
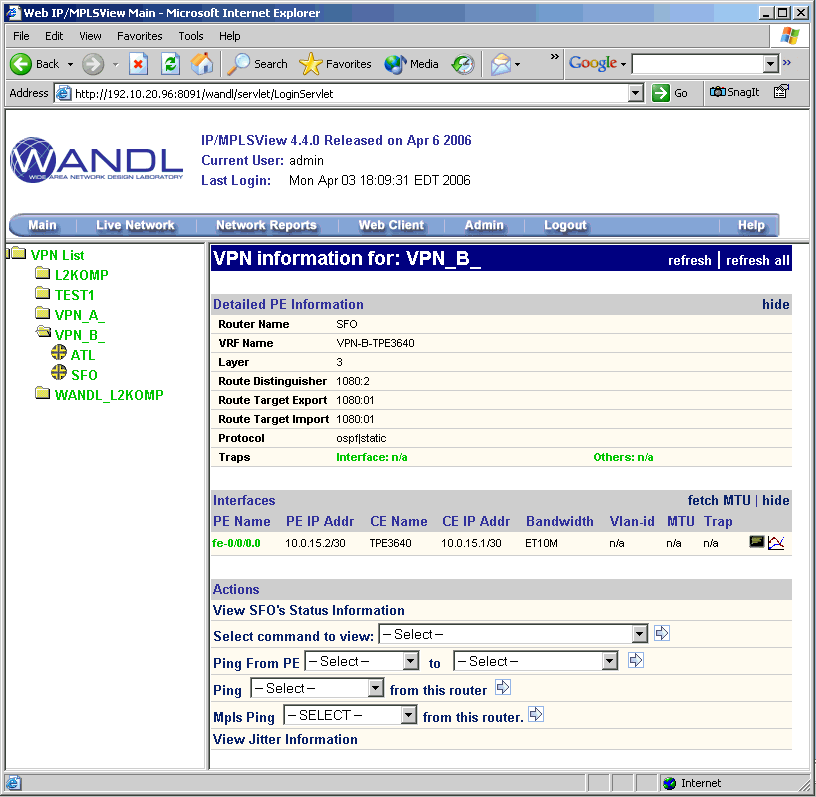
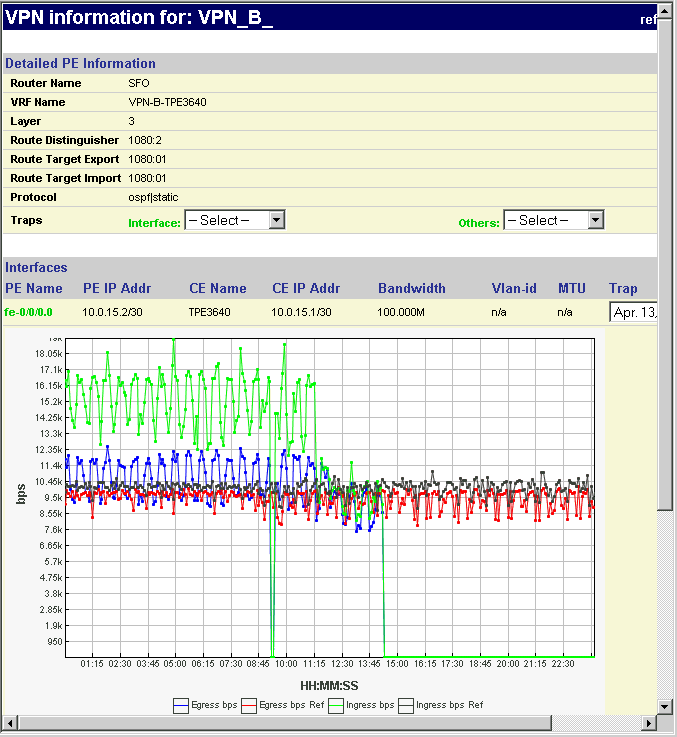
Figure 4: VPN View From the WebWANDL IP/MPLSView tool screenshot showing VPN_B details on IP/MPLSView 4.4.0. Admin user, PE in SFO, VRF VPN-B-TPE3640, Layer 3, ospf/static protocol.
Figure 5: View PE->CE Interface TrafficVPN performance dashboard showing details for VPN_B including router SFO, VRF name VPN-B-TPE3640, Layer 3, route distinguisher 1080:2, and protocols ospf/static. Interface details: PE re-0/0/0.0 with IP 10.0.15.2/30, CE TPE3640 with IP 10.0.15.1/30, 100 Mbps bandwidth. Traffic graph displays egress and ingress bits per second with time on x-axis. Date: April 13.
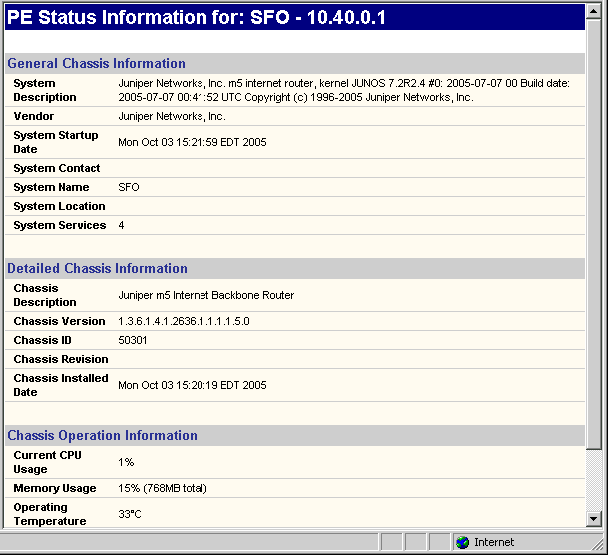
Figure 6: Show PE StatusJuniper Networks M5 Router status: JUNOS 7.2R2.4, Startup Oct 03 2005, SFO, CPU 1 percent, Memory 15 percent, Temp 33C.
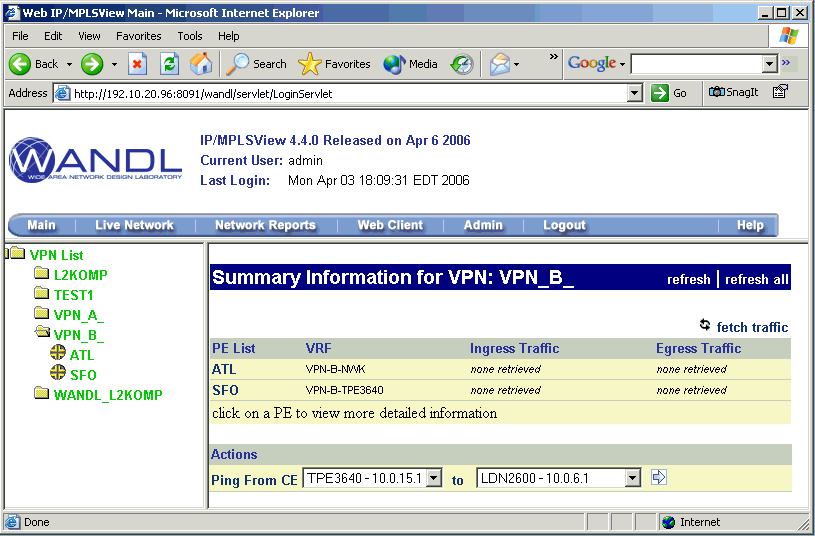
Figure 7: Access VPN Summary InformationWeb-based application interface for managing VPNs using WANDL IP/MPLSView. Shows version 4.4.0, user admin, VPN list with nodes, and ping test option.