The EPE Planner Application in the UI
Overview
The EPE Planner application in the NorthStar Controller UI is built on the NorthStar EPE functionality and in the formulation of plans to minimize the cost of traffic destined for peers. You can use it to plan how to steer traffic into tunnels, taking costs into consideration, and generally manage the EPE planning and execution workflow.
You work in planning sessions called “projects”. A session begins with a “current plan”, represented by a snapshot of the live network. From there, you formulate plan changes, along with step-by-step execution plans to make the proposed changes safely in the network. Ultimately, you can execute the plans in the live network.
This topic introduces you to the EPE Planner UI. See Understanding the EPE Planner Application for information on traffic steering concepts and how the EPE Planner works.
The basic workflow in the UI includes these phases:
Configuring Your Settings Preferences
The EPE Planner creates new projects with the settings that you establish as your preferences. You can modify your preferences at any time. The new preferences only affect subsequent new projects, not existing projects.
Creating a New Project
A summary of the new project is displayed in the EPE Planner window. Projects only remain active for a certain amount of time after they are created.
Finding Plan Changes
In this phase, you direct the EPE Planner to find plan changes that could improve the performance of the EPE plan in your network. Select a plan change to work with.
Creating Execution Plan Steps
Break down the plan change you selected into steps that are small enough to be safely executed. The result is an execution plan.
Executing the Plan Steps in the Network
The great advantage to using the EPE Planner is that you can see the effect of various plan steps before you actually execute them in the network. When you do execute the plan steps in the network, you already know what should happen as a result.
Launch the EPE Planner application by navigating to Applications > EPE Planner. The EPE Projects window opens. If you have active projects already, they are displayed in this window.
Configure Your Settings Preferences
To set up (or modify) your settings preferences, click the Menu button (vertical dots) in the upper right corner of the window, and use the drop-down menu to select Settings. Figure 1 shows the upper right corner of the EPE Projects window, including the drop-down menu from the Menu button.
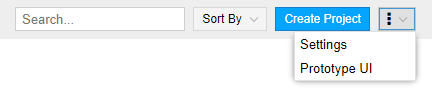
The Prototype UI option, also available from this drop-down menu, launches the UI the NorthStar team uses for development and demonstration. You are welcome to access it, but we are not providing any documentation as it is only available until all of its features have been captured in the production UI.
The prototype UI:
Supports only the peer link-related options for finding plan changes and constructing execution plans.
Does not automatically update in response to changes on the server. To see updates, refresh your browser window.
Provides a preview of the improved animations of plan changes and execution plans that you will see in a future version of the production UI.
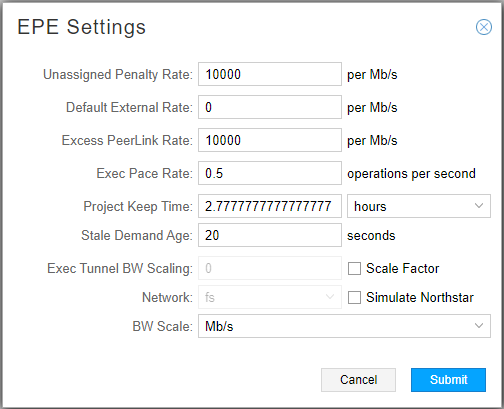
The EPE Settings window is shown in Figure 2 and the fields are described in Table 1.
Setting |
Description |
|---|---|
Unassigned Penalty Rate |
Used to weight the cost of the traffic that is not engineered by a plan (unassigned traffic). The cost of unassigned traffic is the sum of the bandwidth for that traffic times the unassigned penalty. The higher the value, the greater the cost of unassigned traffic. The default is 10000. The units (b/s, Kb/s, or Mb/s) can be changed using the BW Scale drop-down menu, which changes the units (scale) for all relevant settings. Note:
The default is deliberately high in order to keep the EPE Planner from changing all traffic to unassigned. You can lower the value as needed. |
Default External Rate |
The rate used for remote ASBR-prefix combinations that do not have an explicitly listed rate for the prefix in the ASBR’s EPE properties. Note:
ASBR EPE properties can only be managed through the REST API at this time. The default is 0 which means that the EPE application will not assign traffic for any prefix that is not explicitly listed in the EPE properties for the remote ASBR to a tunnel leading to that ASBR. The units (b/s, Kb/s, or Mb/s) can be changed using the BW Scale drop-down menu, which changes the units (scale) for all relevant settings. |
Excess PeerLink Rate |
If a change plan assigns more traffic to a peer link than the maximum peering cost bound, then this cost factor is used to rate the excess traffic. See Peering Costs in Understanding the EPE Planner Application for more information. The default is 10000. The units (b/s, Kb/s, or Mb/s) can be changed using the BW Scale drop-down menu, which changes the units (scale) for all relevant settings. |
Exec (Execution) Pace Rate |
Configures the maximum rate at which to change the network in units of operations per second to avoid problems with PRPD/SR/steering loading and routing. The default is 0.5. |
Project Keep Time |
The number of hours or days (use the drop-down menu to select) until an EPE project is automatically deleted. The current plan becomes out of sync with the live network over time, so planning would be invalid if the current plan gets old. The default is 2.777 hours. |
Stale Demand Age |
Time in seconds after which a demand is considered stale, and is not used when determining the traffic for an EPE project. The default value is 20 seconds. |
Exec Tunnel BW Scaling |
The value to provide for the Execute Plan Change Start method. Click the Scale Factor check box to activate the scaling, and enter a value. The default is 0. If the value is non-zero, tunnels are resized for the amount of traffic being steered onto them. The calculated bandwidth is multiplied by this factor, so if you set it to a value greater than 1 you can reserve some extra bandwidth for traffic growth. |
Network |
The name of the simulated network the EPE Planner will use if NorthStar simulation is enabled. Using a simulated network can be useful for learning how the EPE Planner application works. Click the Simulate NorthStar check box to activate NorthStar simulation and use the drop-down list to select a network to use. |
BW Scale |
Scales the bandwidth received by NorthStar for use in the EPE application according to the units you select with the drop-down menu. |
Once you have entered your preferences, click Submit. New projects are now created with the settings you have specified.
Start a Project - Get the Current EPE Plan
To start a new project, click Create Project in the upper right corner. The Create EPE Planner Project window is displayed as shown in Figure 3.
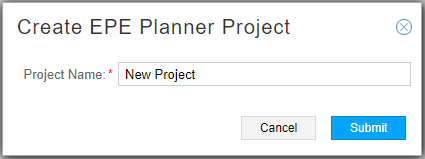
Enter a name for the project and click Submit.
EPE Planner creates the new project with the settings from your preferences, and displays a summary in a “card” on the main EPE Planner window, as shown in Figure 4. If you have multiple active projects, they are all displayed there. Searching and sorting functions are available in the upper right corner of the window to help you locate a particular project.
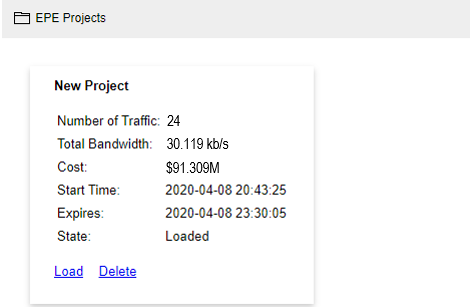
The information displayed for each project includes the time window (Start Time and Expires fields) in which the project will be available.
To proceed with the planning session, click Load at the bottom of the project card. The project loads an EPE network and associated current plan which is created based on a snapshot of the live network’s demands, tunnels, links, and nodes. This snapshot is your starting place. See Figure 5 for an example of the initial display.
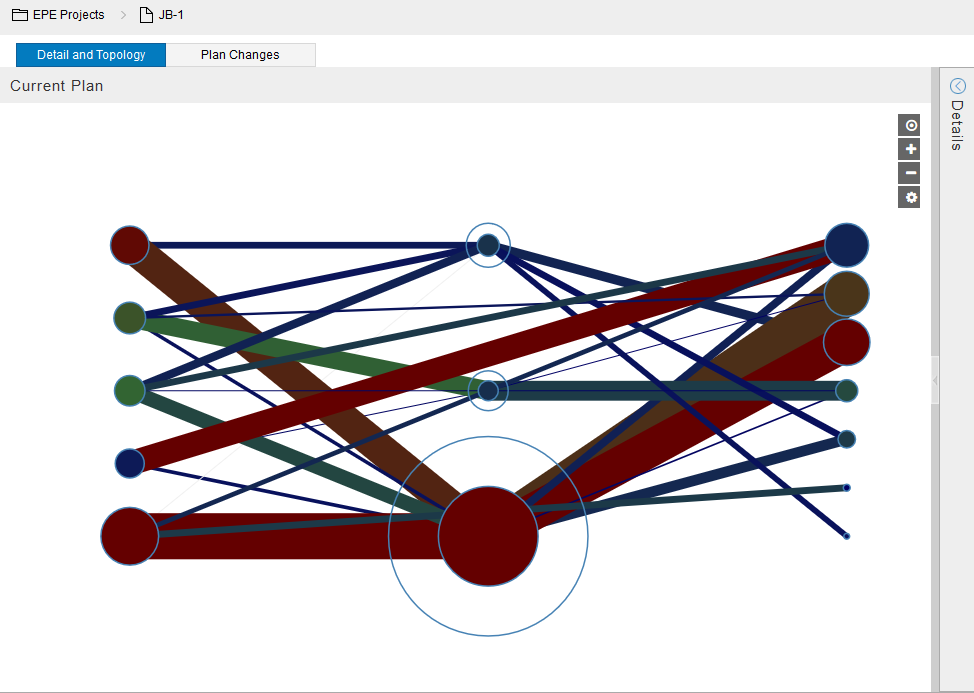
There are two tabs in this window: Detail and Topology (the default initial display) and Plan Changes.
In the Detail and Topology tab, the following features are available:
The topology elements are arranged with PEs on the left, peer links in the middle, and prefixes on the right. The size and color of elements in the topology are significant:
Relative Gb/s is represented by size. Larger has more bandwidth, smaller has less.
Relative cost is represented by color. Red is expensive, blue is not, and green is in between.
The peer links in the middle are represented by a dot inside a circle:
The dot represents the actual use of the peer link.
The circle represents the capacity of the peer link.
When the dot and circle are nearly the same size, the peer link is close to capacity. If the dot becomes larger than the circle, the peer link is overloaded.
Tunnels are shown connecting PEs to peer links. External routes are shown connecting peer links to prefixes. Thick red tunnels/external routes cost more than thinner green tunnels/external routes.
Unsteered (unassigned) traffic is shown as connecting directly from a PE to a prefix without being routed through a peer link in between.
To the right of the display are buttons to center the topology (bullseye icon), zoom in (+ symbol), zoom out (minus symbol), and open the topology Settings window (gear icon).
The topology settings currently available are:
Show Tooltips
When tooltips are enabled, you can mouse over an element in the topology to display information about that element, as shown in Figure 6.
Figure 6: Tooltips Example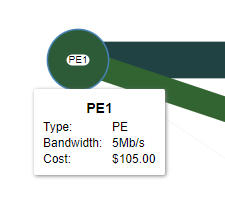
Show Labels
When labels are enabled, the elements in the topology are labeled as shown in Figure 7.
Figure 7: Labels Example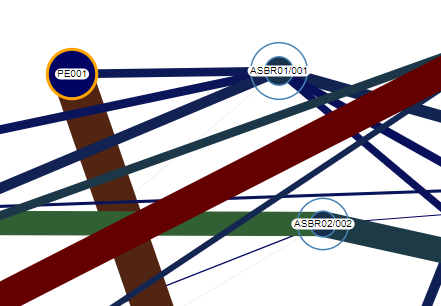
Click the check box to enable or disable tooltips or labels.
Drag-and-drop functionality is supported for arranging elements in the topology display.
The Details window is minimized initially, but you can slide it into view by clicking the arrow in the upper right corner of the display as shown in Figure 8.
Figure 8: Click the Arrow to Display Details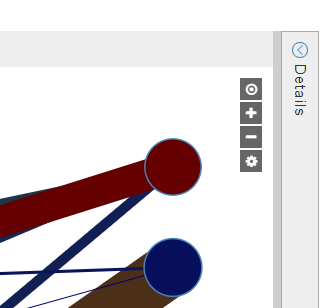
Initially, the Details window, as shown in Figure 9, has two tabs: PE/PeerLink/Prefix and Traffic Assignments.
Figure 9: Details Window Example, PE/PeerLink/Prefix Tab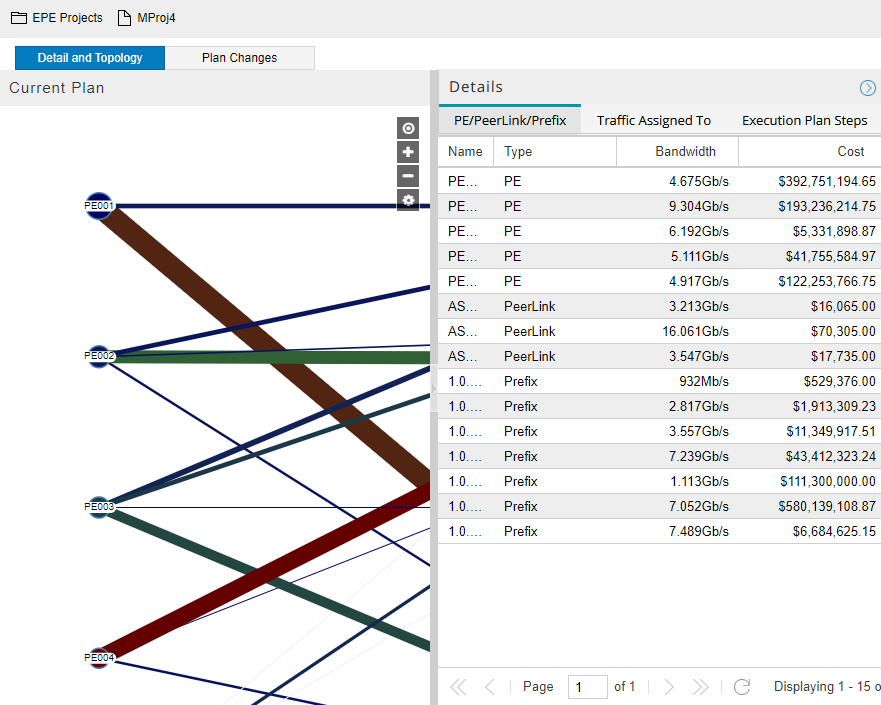
Click an element in the Details window to highlight it in the topology. To hide the Details window, click the arrow in the upper right corner again.
Use the Plan Changes tab to instruct the EPE Planner to find potential plan changes that meet the criteria you specify, and to view the results. This is discussed further in Find Plan Changes.
Find Plan Changes
Use the EPE Planner as a tool to find plan changes that could improve the performance of the EPE plan in your network. Click the Plan Changes tab to begin; the Find Plan Changes window is displayed. Use the Free Traffic Test drop-down menu to specify what currently-assigned traffic the EPE Planner application is free to move as it searches for improvements to the current plan. The choices are shown in Figure 10.
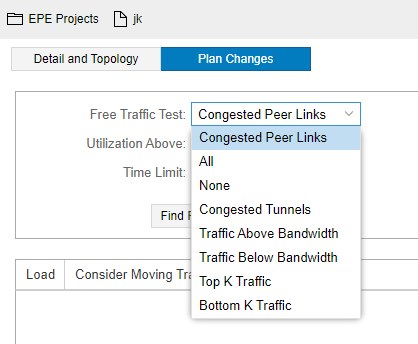
Fields for additional criteria are also displayed, depending on the free traffic test you select, but there is always a field in which to specify a time limit for searching for and improving upon the current plan.
Once you complete the criteria fields, click Find Plan Changes. Possible plan changes appear in the table below the criteria fields, displaying their:
Cost ($)
Cost Change (%)
Number of Traffic Changes
Number of Tunnel Changes
Number of Peer Link Changes
Bandwidth Moved (Xb/s)
In the Load column, click the check box beside a plan change you want to consider implementing. The display switches to the Detail and Topology view and the plan change information is displayed to the left of the topology. Below the plan change information is an Execution Plan section where you will build your step-by-step execution plan. This is described further in Create Execution Plan Steps.
Once a plan change is loaded, the Detail window shows both current and optimized bandwidth and cost so you can see what would be gained or lost. Elements in the Details window (PE/PeerLink/Prefix or Traffic Assignments tab) that show as red would become bigger/more expensive. Elements that show as green would become smaller/less expensive. This information should help you decide whether the change should be executed. When a plan change is loaded, a third tab (Execution Plan Steps) becomes available on the Details window. Figure 11 shows an example of the Details window at this stage.
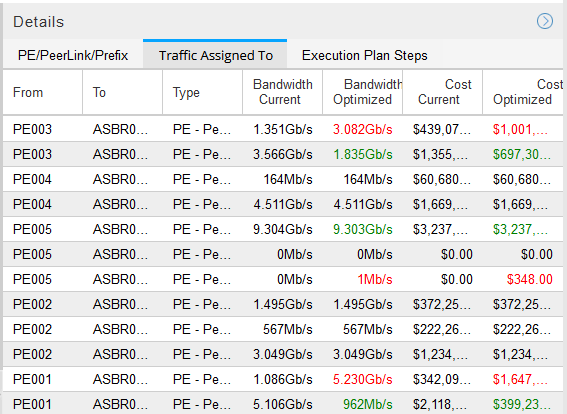
There is nothing in the Execution Plan Steps tab until you start building your execution plan. See Create Execution Plan Steps.
Right-click on the topology and select Animate Plan Change to see the topology elements change as they go from the current plan to the new plan. You can also use the right-click menu to open a pop-up window displaying a Sankey diagram. In a Sankey diagram, the width of the bands is proportional to the volume of traffic. An example Sankey diagram is shown in Figure 12.
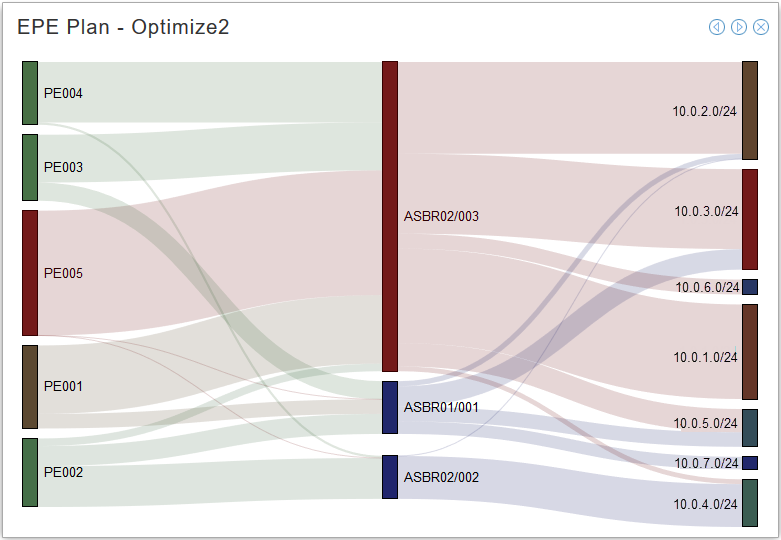
The Sankey diagram uses the same color scheme used in the plan topology. Animate the Sankey diagram using the arrow buttons in the upper right corner.
Create Execution Plan Steps
Once you have selected a plan change to work with and the Execution Plan fields are displayed below the Plan Change details on the left side of the window, you can start building your execution plan, step by step. An execution plan is a way of breaking down the plan change into steps that are smaller, safely executable plan changes. The goal is to create an execution plan that implements the whole plan change, but you can also create partial execution plans that only implement some of the overall plan change.
The execution plan updates LSP bandwidths and bindings in the network until the new plan is achieved. You control this by specifying which of the remaining traffic changes not already in a step should be included in the next step.
Use the Traffic Change Test drop-down menu (lower left corner of the window) to select how the EPE Planner should evaluate whether each of the remaining traffic changes should be included in the next step. Figure 13 shows the traffic change test options that are available.
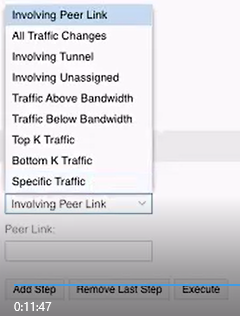
A second field for qualifying information appears, appropriate for the traffic change test you select. For example, if you select Involving Peer Link as the traffic change test, a second field called Peer Link requires you to specify a peer link. Click the peer link on the topology map and the Peer Link field is automatically populated for you. If you select ASBR01/001, the execution step would include all the traffic changes that involve that peer link.
Click Add Step to add the step to the execution plan. In the Execution Plan Steps tab on the Details window, you can see the steps being added as you build your plan. If you change your mind about the last step, you can remove it from the plan by clicking Remove Last Step. You can also right-click on the topology map to bring up the option to animate the plan. If you highlight a step in the Execution Plan Steps tab, you can animate that single step.
If there are no traffic changes that would qualify for inclusion in the step, based on the criteria you specify, a message is displayed to that effect, and you are not allowed to create that step. When the total number of traffic changes in your Plan Change (displayed in the Plan Change information on the left side of the window) is the same as the number of traffic changes in your execution plan (displayed in the Execution Plan Steps tab in the Details window), you have reached the end of your plan change and there are no more traffic changes to be added to a step. The cost and cost change figures will also match.
Execute the Steps in the Network
Some considerations for a good execution plan:
A good plan does not create undesirable conditions, like the overloading of peer links or tunnels, along the way.
A good plan usually divides the needed changes fairly evenly among the steps.
Important changes that reduce the cost considerably are tackled early in a good plan. Taking traffic off already overloaded peer links is an example.
Once you are happy with the execution plan, click Execute to execute the steps in the network. You should be able to see differences in the Demands tab of the network information table in the main UI if the optimization was successful.
Viewing and Modifying EPE Properties in the Network Information Table
EPE properties for tunnels (SR), links, and nodes can be viewed and modified from the network information table.
EPE Properties for Tunnels
EPE Properties is an optional column available in the Tunnels tab of the network information table. Hover over a column heading to display the down arrow, and select Columns. Click the check box for EPE Properties. Remember that you can change the order of columns in the table by clicking and dragging the headings.
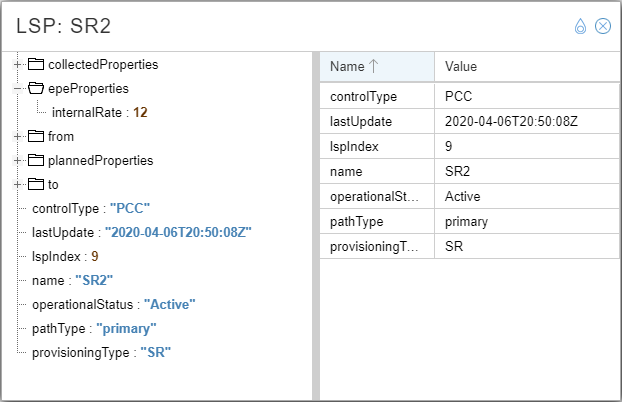
You can view EPE properties for a tunnel by double-clicking the tunnel row in the network information table (Tunnel tab). A pop-up properties window similar to Figure 14 displays. In this window, the information is view-only. Internal Rate (internalRate) is the only EPE property available for tunnels. The internal rate is a representation of the internal transit costs. Internal transit costs are specified by a cost-per-unit of traffic value. An internal rate might reflect a number of different factors, such as the distance, number of hops, or other metrics of the tunnels between PEs and peer links. See Understanding the EPE Planner Application for more information.
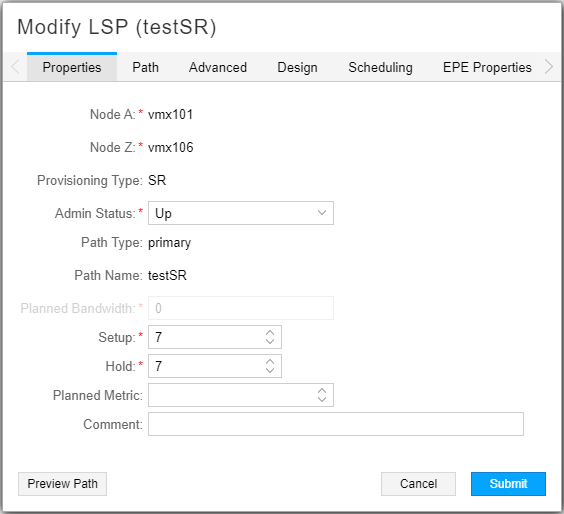
To modify the existing internalRate for an SR tunnel with EPE properties, click the tunnel row to select it, and click Modify in the bottom tool bar. The Modify LSP window displays as shown in Figure 15. The EPE Properties tab only appears for SR tunnels.
Click the EPE Properties tab. From there, you can modify the Internal Rate, as shown in Figure 16.
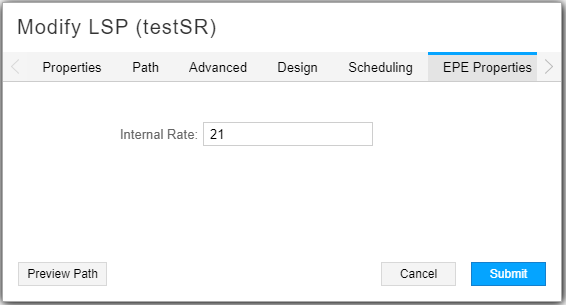
Click Submit to complete the LSP modification.
EPE Properties for Nodes
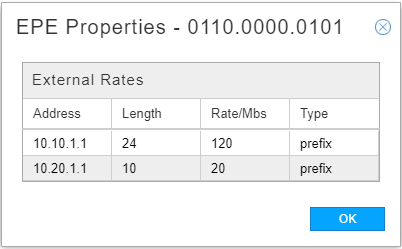
If EPE properties have been set for a node, you can view them by right-clicking a network information table row (Node tab) and selecting EPE Properties. This option is unavailable (grayed out) if no EPE properties have been set. Figure 17 shows an example of the view-only window that displays.
To set or modify EPE properties for a node, select the node in the network information table and click Modify in the bottom tool bar. The Modify Node window displays. Click the EPE Properties tab shown in Figure 18 where you can add or modify the external rates property for the node.
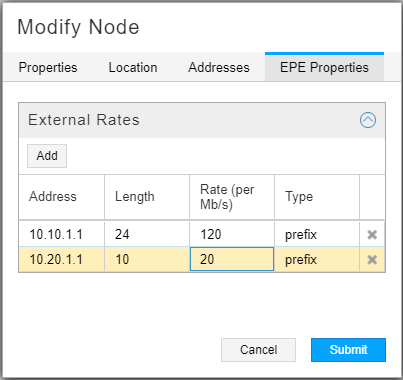
The external rates property (externalRates) is used on the ASBR on the remote ends of peer links to provide the external rate plan for those peer links. See Understanding the EPE Planner Application for more information.
Click Submit to complete the node modification.
EPE Properties for Links
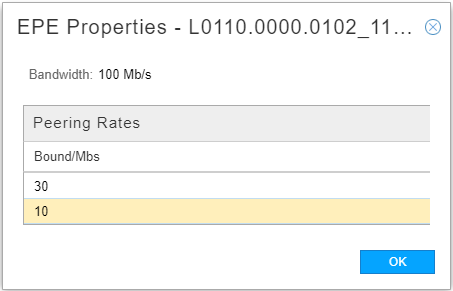
If EPE properties have been set for a link, you can view them by right-clicking a network information table row (Link tab) and selecting View EPE Properties. This option is unavailable (grayed out) if no EPE properties have been set. Figure 19 shows an example of the view-only window that displays.
To set or modify EPE properties for a link, select the link in the network information table and click Modify in the bottom tool bar. The Modify Link window displays. Click the EPE Properties tab shown in Figure 18 where you can add or modify the peering rate bounds property for the link.
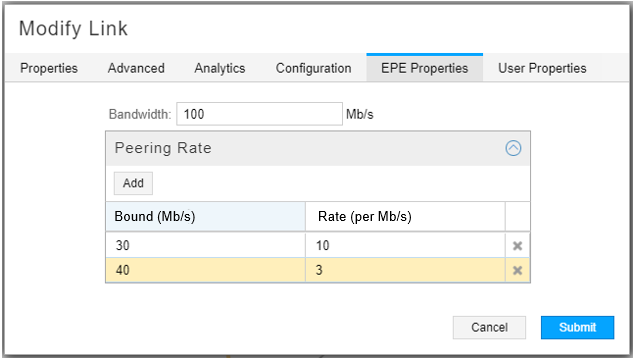
The peering rate bounds property (PeeringRateBounds) is used in defining the peer link usage costs. See Understanding the EPE Planner Application for more information.
Click Submit to complete the link modification.