Scheduling Device Collection for Analytics
The NorthStar Controller Analytics features require that the Controller periodically connect to the network in order to obtain the configuration of network devices. It uses this information to correlate IP addresses, interfaces, and devices.
Completion of device profiles (Administration > Device Profile) is a prerequisite for successfully running device collection tasks.
For topologies that include logical nodes, periodic device collection is necessary because there are no real time PCEP-based updates for logical devices.
To schedule a new device collection task, navigate to Administration > Task Scheduler.
Click Add in the upper right corner. The Create New Task window is displayed as shown in Figure 1. In this figure, the Task Group drop-down menu is expanded.
Figure 1: Create New Task Window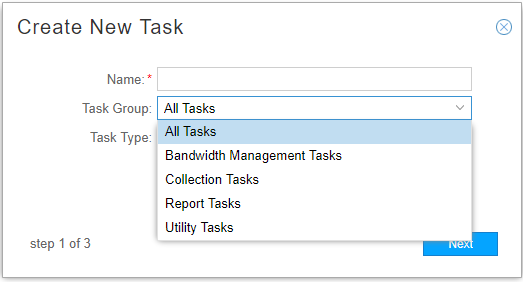
Enter a name for the new task. From the Task Group drop-down menu, select either All Tasks or Collection Tasks. From the Task Type drop-down menu, select Device Collection. Click Next to display the first Create New Task – Device Collection window as shown in Figure 2.
Figure 2: Device Collection Task, All Devices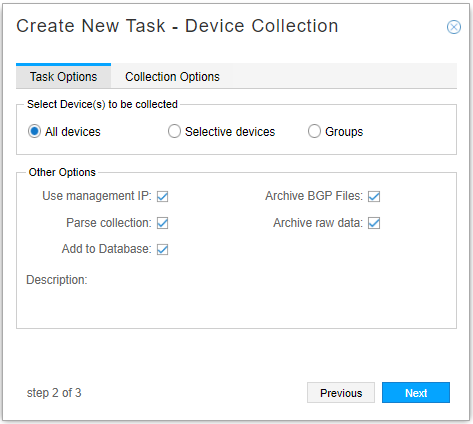
On the Task Options tab, you can choose All devices, Selective devices, or Groups as a method for specifying the devices to be included in the collection task. For all three of those choices, the following fields are available under Other Options (click the check boxes to select):
Use management IP (default is yes).
The behavior related to this option depends on whether the management IP is configured:
Use management IP option selected?
Management IP Configured
Management IP Not Configured
Yes
Only the management IP is tried for collection, whether it is reachable or not.
The IP address is tried for collection.
No
The management IP is tried first for collection.
If the management IP is configured but is not accessible, the IP address is tried for collection.
The IP address is tried for collection.
Parse collection (default is yes).
Parsing reads the content of the files and updates the network model accordingly. If parsing is not selected, the configuration files are collected on the server, but not used in the model.
Archive BGP Files (default is yes)
Selecting this option reduces the memory consumption of large BGP files in NorthStar by compressing data collection files that result from the device collection task.
Add to Database (default is no).
Raw and spec data are added to the database, making it available for import into the NorthStar Planner as a network. This data includes the unparsed collected data from the devices and the device collection task status. The unparsed collected data contains the output of multiple show commands on the devices. When you enable this option, a Description field becomes available.
Archive raw data (default is yes).
Raw data is archived in Elasticsearch.
If you select “Selective devices”, you are presented with a list of all the devices available to be included in the collection task. Figure 3 shows an example.
Figure 3: Device Collection Task, Selective Devices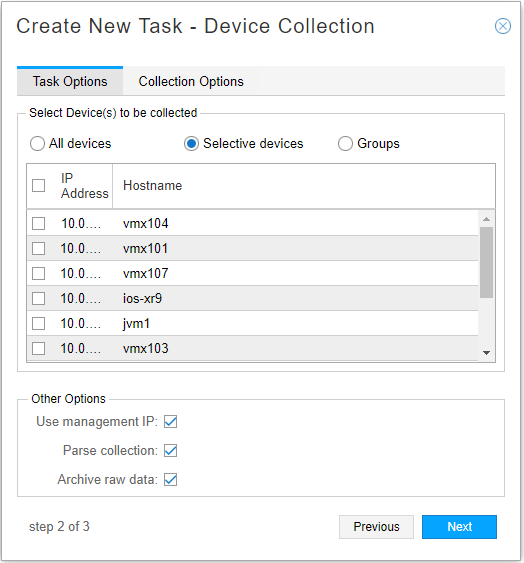
Click the check boxes corresponding to the devices you want to include.
If you opt for Groups, you are presented with a list of the device groups that have been configured in Administration > Device Profile, as shown in Figure 4.
Figure 4: Device Collection Task, Groups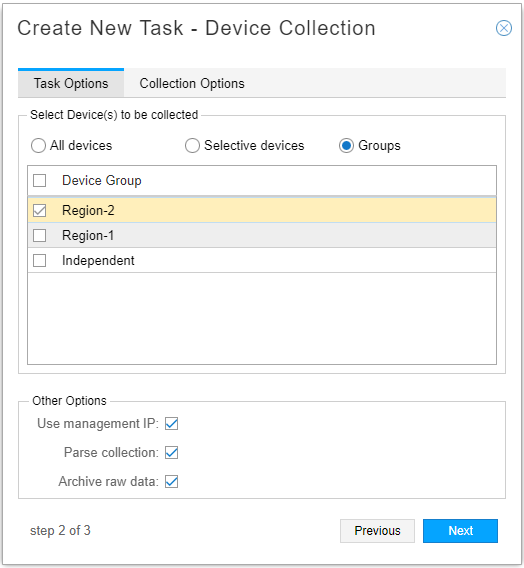
Click the check boxes corresponding to the groups you want to include.
Click Next to continue.
On the Collection Options tab, you can select the types of data to be collected or processed as shown in Figure 5.
Figure 5: Device Collection Task, Collection Options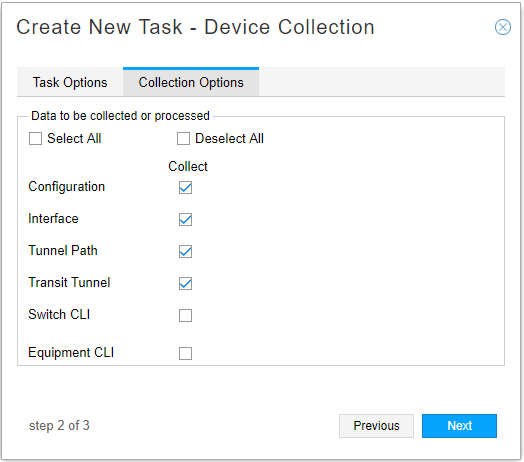
Click the appropriate check boxes to select or deselect options. You can also Select All or Deselect All. By default, the first four options listed are collected.
Note:We recommend that you collect router configuration, tunnel path and tunnel transit show commands when running the device collection task so that NorthStar can update the tunnel status and details based on the latest collection.
Equipment CLI data is collected in device collection tasks that include the Equipment CLI option. The Process Equipment CLI option in Network Archive collection parses the Equipment CLI data collected in device collection and generates the Inventory Report available in both the NorthStar Controller and the NorthStar Planner.
To view Hardware Inventory in the NorthStar Planner, you must run device collection with the Equipment CLI collection option (collects the inventory data) and you must run Network Archive collection with the Process Equipment CLI option (processes the inventory data).
Each of the options results in the collection task capturing the results of various show commands. Table 1 lists the show command output captured for each option.
Table 1: Show Command Output Captured by Device Collection Options Data Type
For Juniper Devices
For IOS-XR Devices
Configuration
show configuration | display inheritance brief | no-more
show running
Interface
show configuration system host-name | display inheritance brief
show interfaces | no-more
show running | include hostname
show interfaces
show ipv4 interface
Tunnel Path
show configuration system host-name | display inheritance brief
show mpls lsp statistics ingress extensive logical-router all | no-more
show running | include hostname
show mpls traffic-eng tunnels detail role head
Transit Tunnel
show configuration system host-name | display inheritance brief
show rsvp session ingress detail logical-router all | no-more
show rsvp session transit detail logical-router all | no-more
show running | include hostname
show mpls traffic-eng tunnels backup
Switch CLI
show configuration system host-name | display inheritance brief
show l ldp neighbor | no-more
show virtual-chassis status | no-more
show running | include hostname
show cdp neighbor detail
Equipment CLI
show configuration system host-name | display inheritance brief
show version | no-more
show chassis hardware | no-more
show chassis fpc | no-more
show chassis hardware models | no-more
show version
show diag
show env all admin
show inventory
show inventory raw
Click Next to proceed to the scheduling parameters. The Create New Task - Schedule window is displayed as shown in Figure 6. You can opt to run the collection only once, or to repeat it at configurable intervals. The default interval is 15 minutes.
Figure 6: Device Collection Task, Scheduling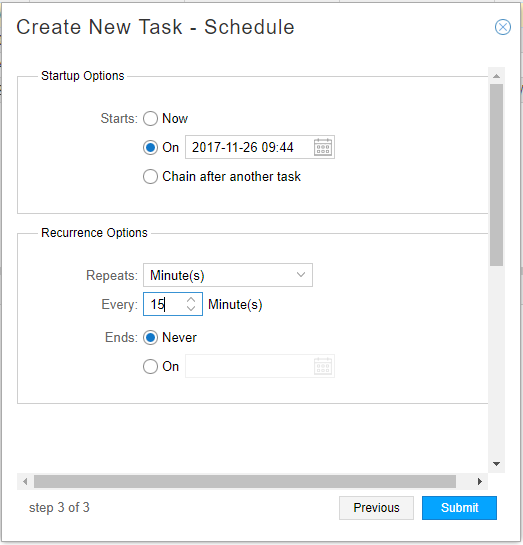
Instead of scheduling recurrence, you can select to chain the task after an already-scheduled recurring task, so it launches as soon as the other task completes. When you select the “Chain after another task” radio button, a drop-down list of recurring tasks is displayed from which to select.
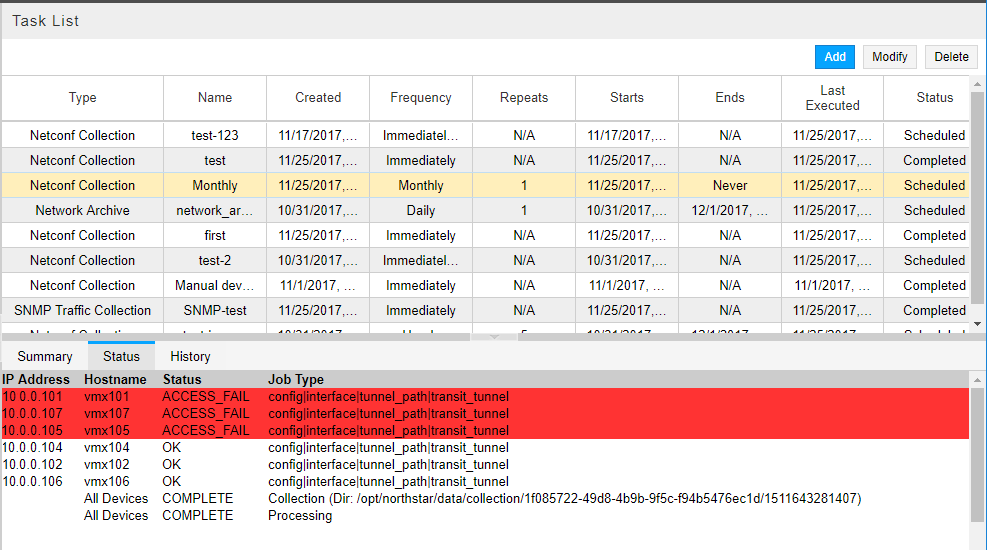
Click Submit to complete the addition of the new collection task and add it to the Task List. Click a completed task in the list to display the results in the lower portion of the window. There are three tabs in the results window: Summary, Status, and History. Figure 7 shows an example of the Summary tab. Figure 8shows an example of the Status tab.
Figure 7: Device Collection Results, Summary Tab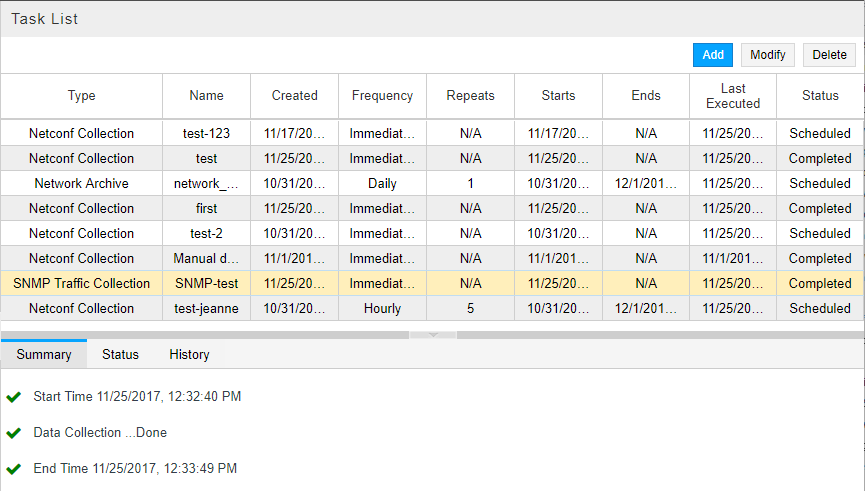 Figure 8: Device Collection Results, Status Tab
The device collection data is sent to the PCS server for routing and is reflected in the Topology view. See Viewing Analytics Data in the Web UI for more information.
