Report Manager
To reach the Report Manager in the NorthStar Planner web UI, click the menu icon (horizontal bars) in the upper left corner of the Planner and select Report Manager (a network must be open for this option to be available).
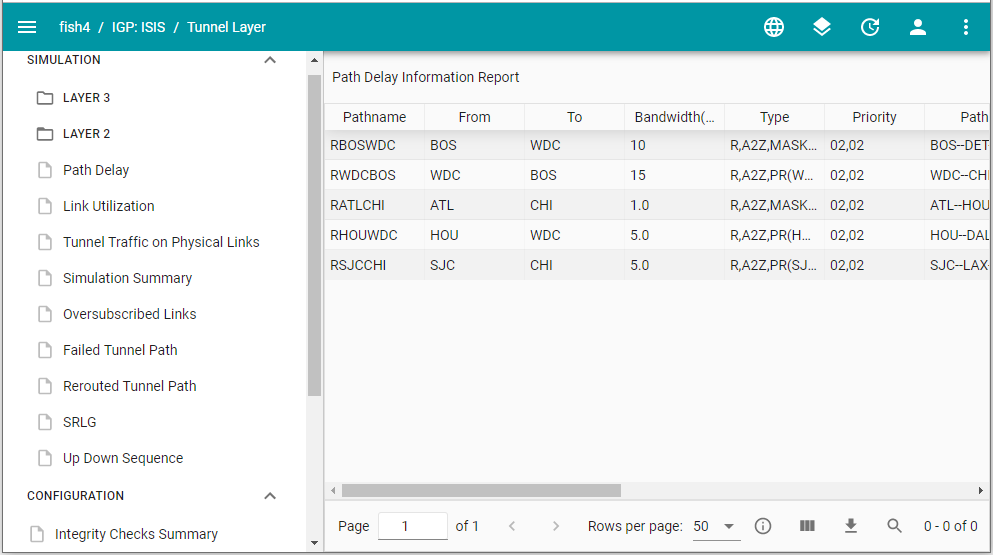
A list of reports is displayed on the left side of the window and the contents of the selected report displays on the right side. Any report name that is grayed out has not been generated for the network. Reports can generate with no content if there is no applicable data for the report. Figure 1 shows an example of the Report Manager with the contents of a selected report displayed on the right. Simulation reports generated at Layer 2 and Layer 3 are available in separate folders.

Available Reports
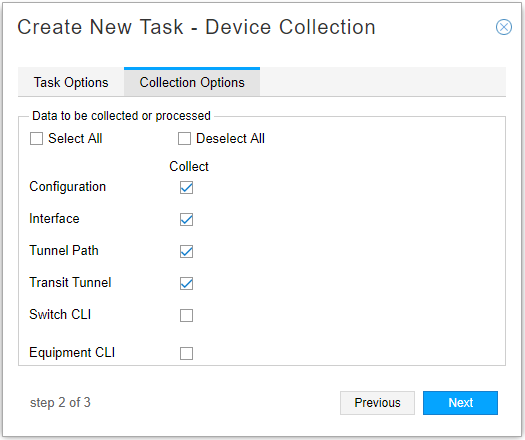
Configuration reports are available after running Administration > Task Scheduler > Device Collection in the NorthStar Controller (Operator). Collection Options must be set to include Configuration as shown in Figure 2.

Simulation reports are available after running a simulation in NorthStar Planner.
Sorting Report Data by Column
By clicking in any report column heading, you can sort the report data by that column, either ascending or descending. The report data remains sorted if you download the report.
Report Manager Bottom Tool Bar
At the bottom of the right pane in the Report Manager, there is a tool bar with several useful functions, described in Table 1. These tools can help you navigate through pages of report data and filter the columns of data that are displayed. Figure 3 shows the tool bar.

Tool or Button |
Description |
|---|---|
Page __ of <total pages> |
Shows which page of data is currently displayed and the total number of pages. If you click in the page box, up and down arrows appear which you can use to page forward or back. |
< |
Displays the previous page of data. |
> |
Displays the next page of data. |
Rows per page |
Click the down arrow to select the number of rows per page (10, 50, 100, 500, or 1000). |
|
Click the Information icon to display some additional information about the selected report, including the date and time the report was generated. |
|
Click the Columns icon to launch the Column Chooser tool. The resulting list of available columns is different, depending on the selected report. Click the check boxes to select or deselect the columns for display. If you download the report, your selections remain intact. |
|
Click the Download icon to download the selected report in a csv file to your local downloads location. Any sorting or filtering you performed remains intact in the downloaded version. |
|
Click the Search icon to open a search field. Enter your search criteria where it says “Filter this report”. The report display changes to include only the rows that match your search criteria. If you download the report, this filtering remains intact. To clear the filter so that all report rows are again displayed, clear the search field. |
X - Y of Z |
Number of rows displayed on the current page and the total number of rows in the report. 1-50 of 60, for example. |


