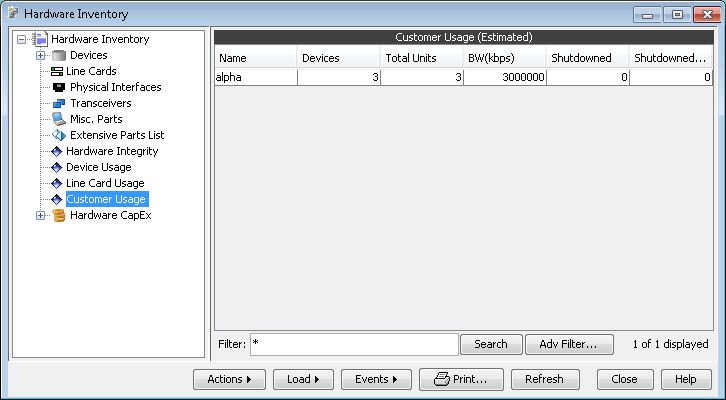
Inventory Menu: Hardware Inventory
When a network is loaded, the Hardware Inventory window can be opened by selecting Inventory > Hardware Inventory. This window contains reports and information about the hardware at each individual node in the network. When viewing hardware information at a specific node, the Hardware Inventory window is split into two panes. The left pane displays a tree listing all existing hardware (routers) and summary reports. The right pane displays the content of the item selected in the left pane.
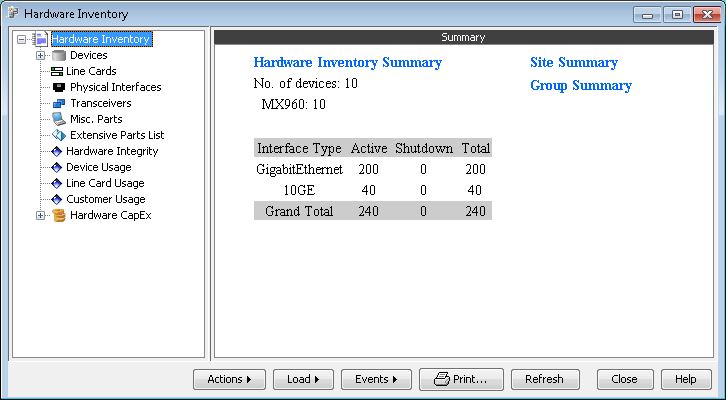
Hardware Inventory Summary
When the Hardware Inventory window is opened, the right pane will show a summary of all the equipment in the network. This provides a quick tally of the number and types of devices and interfaces in the entire network.
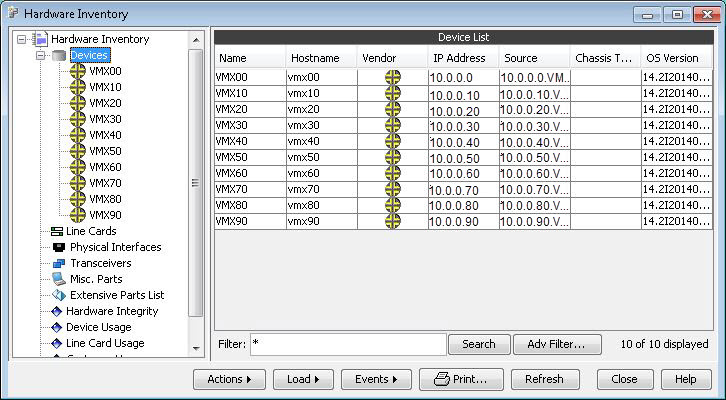
Devices List
Selecting Devices in the left pane displays a Device List report in the right pane. The saved report’s filename starts with “ROUTER_LIST.” Clicking on the small icon to the left of Devices in the left pane will expand the tree to show a list of routers in the left pane. These devices can then be individually selected to display a detailed Equipment View in the right pane for the selected router. See Equipment View for more information
Various actions can be executed by right clicking on a row and selecting an item from the popup menu. The items in this popup menu are available for many reports in the Hardware Inventory window, though not all reports will contain all items.
Node Detail: Brings up a Node window with detailed information about the node in the selected row.
Highlight: Highlights the relevant node in the Map window.
Show Config: Opens the router configuration file for the relevant node if such a file is available.
Show Equipment: This will open the Equipment View window for the relevant node.
The Table Options window can be opened by right clicking on a row in a report and selecting Table Options. This is useful for customizing the type of information displayed in the report.
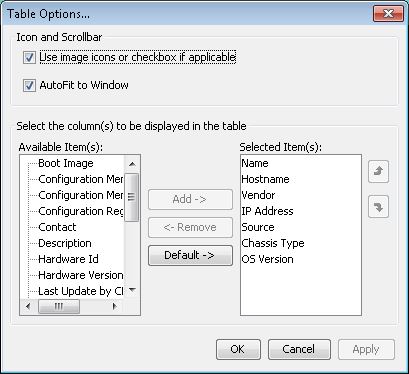
Selecting Use image icons or checkbox if applicable displays image icons in vendor and status cells that make the reports more visually pleasing and easier to comprehend at a glance. The Autofit to window option will, when selected, automatically resize the column widths to fit the width of the report window. In the bottom half of the Table Options window, specific columns can be either included are excluded from the report.
Columns |
Description |
|---|---|
Name |
Device name converted into NorthStar Planner format |
Hostname |
Device hostname |
Vendor |
Device vendor (for example, Cisco, Juniper Networks) |
IP Address |
Loopback IP address of the Device, typically the first one listed |
Source |
Filename of collected configuration file |
Chassis Type |
The type of chassis, for example, WS-C6509-E (similar to SNMP chassisType) |
OS Version |
Operating System Version, for example, 12.2(53)SE |
Contact* |
SNMP sysContact |
Description |
Device description |
Location* |
SNMP sysLocation |
System Name* |
SNMP sysName |
Boot Image |
The boot image, e.g, a string starting with flash:, bootflash:, disk0: |
Configuration Memory |
Non-volatile configuration memory (bytes) |
Configuration Memory in Use* |
Non-volatile configuration memory in use (bytes) SNMP nvRAMUsed |
Configuration Register* |
SNMP configRegister, for the configuration register value |
Hardware Id |
Equivalent of SNMP chassisId, which defaults to the chassis serial number |
Hardware Version |
Equivalent of SNMP chassisVersion, which defaults to the chassis hardware revision level |
Last Update by CLI |
The last time this file was updated by CLI collection |
Memory |
Equivalent of SNMP processorRam, based on RAM available to CPU (bytes) |
Mgmt IP Addr |
The Management IP Address is the IP addressed used by NorthStar Planner to discover the device. |
Model |
The Hardware model can provide additional detail not known from the vendor, for example, by distinguishing JUNIPER and JUNIPER_EX |
OS Family |
The operating system family (for example, IOS, Junos OS) |
Processor |
The device processor, for example, PowerPC405 |
ROM System Version* |
SNMP romSysVersion, which contains the ROM system software version |
ROM Version |
SNMP romVersion, which contains the ROM monitor version |
SNMP fields will not be populated if hardware inventory is collected by CLI.
Line Cards
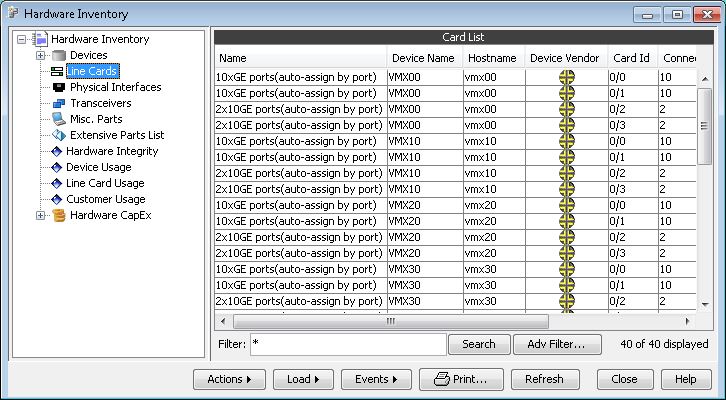
Selecting Line Cards in the left pane displays a
Card List with information on all the cards in the network. The saved
report name starts with CARD_LIST. This
list is useful for managing aspects of a network related to card capacity,
such as keeping track of how many ports of a specific type are available
in the network. The Table Options (right-click a table header for
this menu option) can be used to add additional columns such as the
Version.
Column |
Description |
|---|---|
Hostname |
Device hostname |
Name |
Line card name, for example, WS-X6704-10GE |
Device Name |
Device name converted into NorthStar Planner format |
Device |
Vendor Hardware vendor (Cisco, Juniper Networks) |
Card Id |
Slot information, for example, S-0/1 |
Connected |
Ports Number of ports that (a) have a corresponding link in the model, (b) are operationally up, or (c) have an IP address defined on the interface |
No. of Ports |
Number of physical ports |
Part |
Line Card Part number |
S/N |
Line Card Serial number |
Version |
Line Card Version information, for example, rev A0 ver 4 |
Controller Mem.* |
Controller memory (Cisco-specific field) |
Cost (Estimated) |
Estimated hardware cost |
Description |
Line Card Description |
Device IP Addr. |
Loopback IP address of the Device, typically the first one listed |
Device Mgmt IP Addr. |
The Management IP Address is the IP addressed used by NorthStar Planner to discover the device. |
FRU Line Card FRU Packet Mem. FRU Route Mem. |
Details related to the Field Replacement Unit (Cisco) |
L3 Engine L3 Engine Type |
Details related to the L3 Engine (Cisco) |
Reserved Ports |
Number of Reserved ports, based on customizable keywords found in the description. |
Shutdown Ports |
Ports that have operational or admin status down |
TAN |
Top Assembly Number (Cisco ordering number) |
NMP fields will not be populated if hardware inventory is collected by CLI.
Physical Interfaces
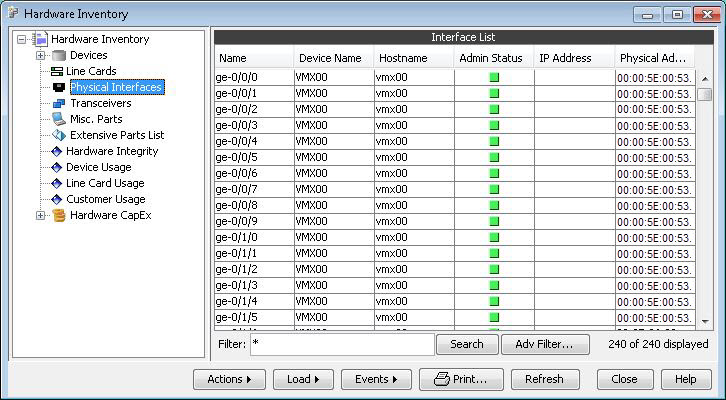
Selecting Physical Interfaces in the left pane displays an Interface List report listing all interfaces, their status, and additional information in the right pane. The saved report’s filename starts with “INTF_LIST.” The rows in the report can be sorted by clicking on the column header for the property to sort by.
Column |
Description |
|---|---|
Name |
Physical Interface Name, for example, TenGigE0/2/0/2 |
Hostname |
Device hostname |
Device Name |
Device name converted into NorthStar Planner format |
Device Vendor |
Hardware vendor (Cisco, Juniper Networks) |
Card Id |
Slot information, for example, S-0/1 |
Description |
Physical interface description |
IP Address |
IP address of physical interface, if assigned |
Device IP Addr. |
Loopback IP address of the Device, typically the first one listed |
Device Mgmt IP Addr. |
The Management IP Address is the IP addressed used by NorthStar Planner to discover the device. |
Admin Status |
Interface Administrative status (active, down, or unknown) |
Physical Address |
The address of the physical interface, based on intfmap NorthStar Planner file. |
Aggregated Link |
Any associated aggregated link, such as PortChannel or Bundle-Ether |
Bandwidth T |
he physical interface bandwidth, for example, 100.0M |
IPv6 |
IPv6 address information (based on NorthStar Planner intfmap file) |
MTU |
MTU information (based on NorthStar Planner intfmap file) |
Media Type |
The Physical interface media type, for example, ATM,BRI,BVI,Cable,Channelized E1,DS,E1,Ethernet,FE,GE,OC3/STM1,T1,T3 |
Operational Status |
Interface Operational Status (active, down, or unknown) |
Switchport Mode |
Switchport mode for layer 2 interfaces, for example, access or trunk |
VLAN |
List of VLAN’s for this physical interface, for example, “22 100-102 105-108” |
Transceivers
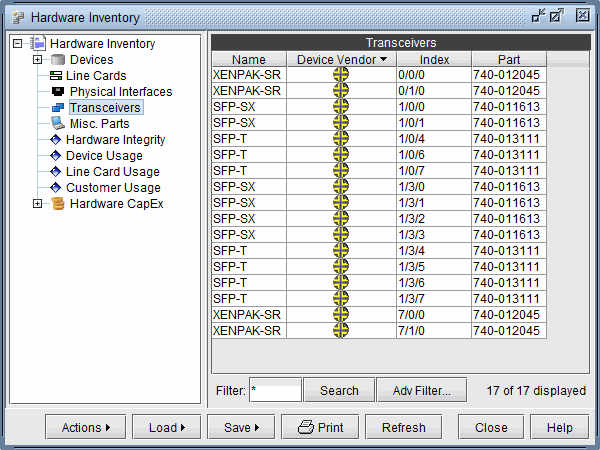
Selecting Transceivers in the left pane displays
a Transceivers List with information on all the transceivers or small
form-factor modules of devices in the network. This report can be
filtered and sorted by clicking on the appropriate column headers.
The saved report’s filename starts with TRANSCEIVER_LIST_LIST.
Column |
Description |
|---|---|
Name |
Transceiver name, for example, SFP-10GBase-ER |
Hostname |
Device hostname |
Device Name |
Device name converted into NorthStar Planner format |
Device Vendor |
Hardware vendor (Cisco, Juniper Networks) |
Device IP Addr. |
Loopback IP address of the Device, typically the first one listed |
Index |
Slot information, for example, S-0/1 |
Part |
Part number |
S/N |
Serial number |
Cost (Estimated) |
Estimated hardware cost |
Miscellaneous Parts
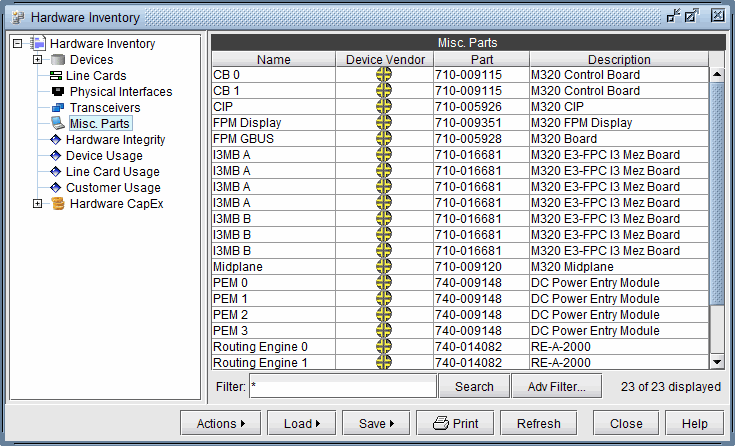
Selecting Misc Parts in the left pane displays a
Miscellaneous Parts List with information on all the power supplies
and fans of devices in the network. This report can be filtered and
sorted by clicking on the appropriate column headers. The saved report’s
filename starts with MISC_PART_LIST.
Column |
Description |
|---|---|
Name |
Name of miscellaneous part, for example, “Power Supply 1” |
Hostname |
Device hostname |
Device Name |
Device name converted into NorthStar Planner format |
Device Vendor |
Hardware vendor (Cisco, Juniper Networks) |
Device IP Addr. |
Loopback IP address of the Device, typically the first one listed |
Description |
Description of miscellaneous part |
Part |
Part number |
S/N |
Serial number |
Cost (Estimated) |
Estimated hardware cost |
Extensive Parts List
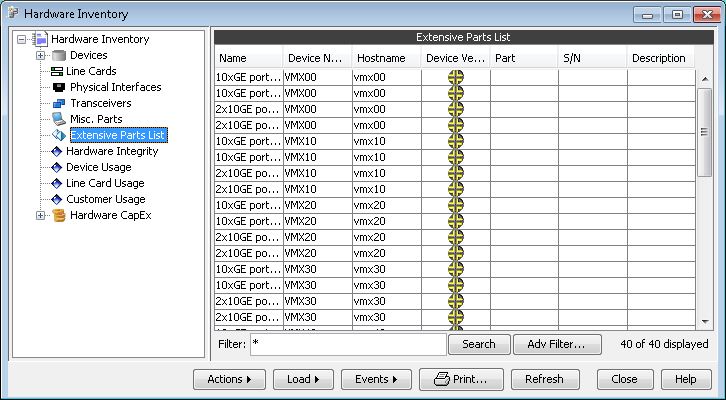
Selecting Extensive Parts List in the left pane displays a report listing all parts along with the part number, serial number, description, and the device it belongs to in the right pane. The rows in the report can be sorted by clicking on the column header for the property to sort by.
Hardware Integrity
The Hardware Integrity report window provides a summary check of possible errors in the hardware configuration as represented by the Hardware Model. This report can be sorted by clicking on the appropriate column headers. This report is useful when, for example, checking to make sure that all links have connected interfaces. The saved report’s filename starts with “HW_IC_REPORT.”
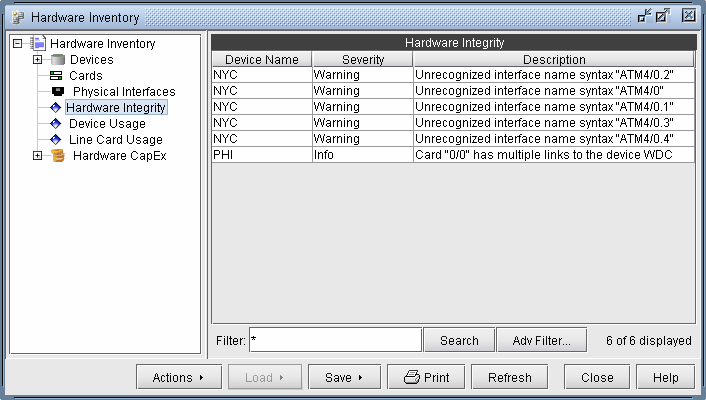
Column |
Description |
|---|---|
Device Name |
Device name converted into NorthStar Planner format |
Severity |
Severity level of integrity check: Info,Severity,Warning |
Description |
Description of the integrity check finding |
Device Usage
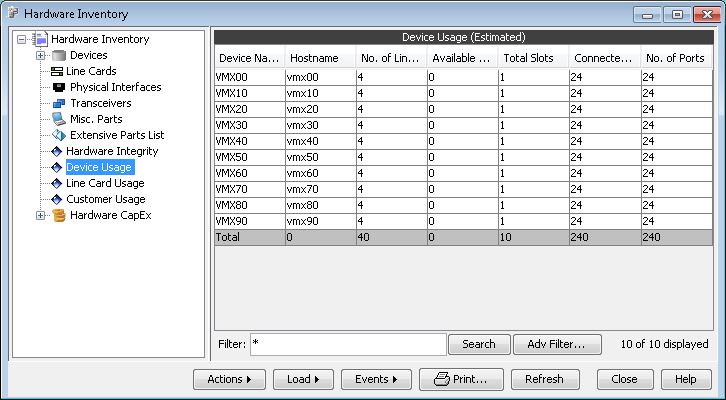
The Device Usage report provides an estimate of the degree to which all the cards and ports in the nodes of the network are being utilized. The report lists total numbers of cards and ports side by side with the number of utilized cards and ports, sorted by node, to give you an idea of where the network stands in terms of hardware capacity and usage at each node. You can also choose to show interface usage through the table options window (by right-clicking on the column headers). The saved report’s filename starts with “HW_DEVICE_USAGE_REPORT.”
Column |
Description |
|---|---|
Hostname |
Device hostname |
Device Name |
Device name converted into NorthStar Planner format |
Occupied Line Cards |
Number of line cards which are used |
Available Line Cards |
Number of line cards which are empty |
Total Line Cards |
Total number of line cards |
Connected Ports |
Number of ports that (a) have a corresponding link in the model, (b) are operationally up, or (c) have an IP address defined on the interface |
No. of Ports |
Total Number of physical ports |
Reserved Ports |
Number of Reserved ports, based on customizable keywords found in the description. |
Shutdown Ports |
Ports that have operational or admin status down |
Line Card Usage
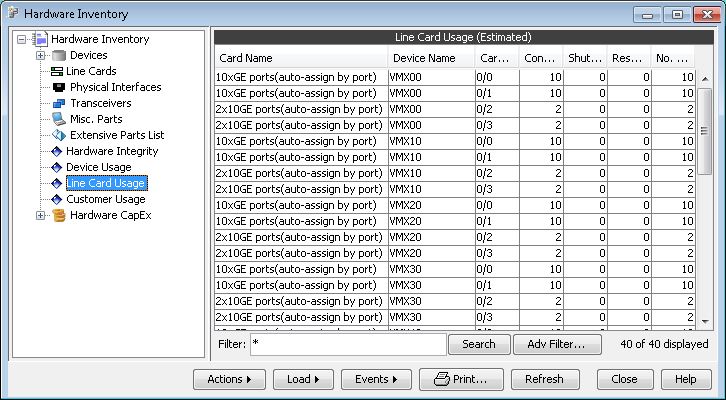
The Line Card Usage report lists all the cards in the network sorted by card type and provides usage information for these cards. This is useful when searching for capacity information, such as the number of port vacancies in a particular type of card in the network. The saved report’s filename starts with “HW_LINECARD_USAGE_REPORT.”
Column |
Description |
|---|---|
Card Name |
Name of line card |
Device Name |
Corresponding device name converted into NorthStar Planner format |
Card Id |
Slot information, for example, S-0/1 |
Connected Ports |
Number of ports that (a) have a corresponding link in the model, (b) are operationally up, or (c) have an IP address defined on the interface |
No. of Ports |
Total Number of physical ports |
Reserved Ports |
Number of Reserved ports, based on customizable keywords found in the description. |
Shutdown Ports |
Ports that are operationally or administratively down |
Customer Usage
The Customer Usage report displays network usage on a per customer basis. Customer names are parsed from the interface comments in the imported configuration files. The regular expression used to parse the customer names can be customized by selecting a device from the Hardware Inventory window, going to the Logical View panel, selecting Actions > Options, and going to the Misc tab. There, you will see a section called Customer Identifier with a field called Use regular-expression in interface description. Enter your custom regular expression here.
The parser looks for customer names within parenthesis. For
example, to match a number sequence in interface comments of the format, cust####..., use the expression, cust([0-9]+).* There is currently no way to define customers other than parsing
them from interface comments in the imported configuration files.
