Web Planner Traffic Aggregation
The Traffic Aggregation function allows extraction of performance data from the analytics database for use in modeling and simulation. You can extract different types of performance traffic into their relative files using a variety of timeframes and traffic statistics. Traffic aggregation is performed on archived networks in the web Planner.
To do traffic aggregation, you must first perform data collection in the NorthStar Controller using Network Archive, LDP Collection, and SNMP Collection tasks. See the following topics in the NorthStar Controller User Guide for information about those task types:
Collection Tasks to Create Network Archives
Needed to create the archived networks for which traffic aggregation is performed.
-
Needed for Demand and Traffic Loads traffic aggregation.
-
Needed for Interface Options and Tunnel Traffic traffic aggregation.
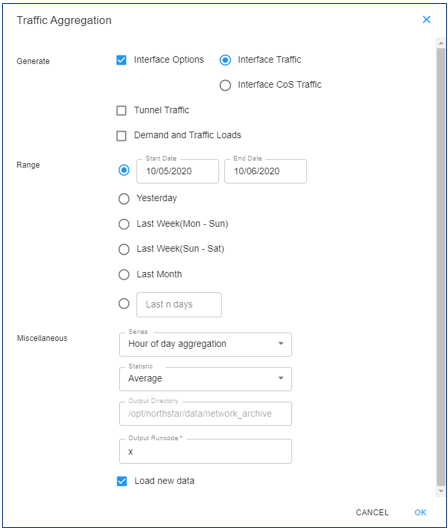
To reach the Traffic Aggregation window in the web Planner, click the More Options icon (three vertical dots) in the upper right corner of the Planner window and select Traffic Aggregation. Figure 1 shows the resulting Traffic Aggregation window.

The overall process is:
Make your selections in the Traffic Aggregation window and click OK.
The traffic aggregation process on the server requests the analytics database to aggregate the performance data according to the selections you provided, and the data are stored to the corresponding traffic files.
Type of Data
Filename
Egress interface traffic
interface
Ingress interface traffic
interfacei
Demand traffic
trafficload
Tunnel traffic
tunneltraf
When complete, a message displays, informing you of success or failure.
If you selected Load new data in the Traffic Aggregation window, the generated traffic results are displayed in the network information table.
Use the information in the following sections to help you define a traffic aggregation that suits your purpose.
Performance Data Indices Used for Aggregated Queries
The analytics database stores performance data in a series of indices. The default index for a measurement contains each measurement to a granularity of five minutes. High frequency measurements collected through Telemetry are stored in a special index used mostly for real-time traffic graphs. The high-speed (raw) index is then recorded as an average into the default index. The default index has a configurable retention period.
The measurements are then rolled up hourly with average and 90 percentile aggregations, and this rolled-up index is used for more scalable queries on the performance data. In addition to the hourly index, the default index is also rolled up into daily, weekly and monthly indices to support queries over longer time frames. .
The performance data indices are summarized in Table 1.
Index |
Interval |
Purpose |
Retention |
|---|---|---|---|
Raw |
Same as collection for high frequency measurements such as Telemetry (30 seconds, for example). |
|
Hard set to 1 day |
Default |
Measurement frequency or five minutes, whichever is less. |
|
Set using the NorthStar CLI: set northstar system scheduler tasks collection-cleanup raw-data-retention-duration |
Rollup |
Rolled up on an hourly, daily, weekly, and monthly basis. |
Produces increased performance and reduced storage needs for traffic reporting and modeling. |
Set using the NorthStar CLI: set northstar system scheduler tasks collection-cleanup rollup-data-retention-duration |
Generate Options
Remember that performing the appropriate data collection tasks in the NorthStar Controller is a prerequisite to performing traffic aggregation.
The generate options are:
Interface Traffic
Interface CoS Traffic
Tunnel Traffic
Demand and Traffic Loads
Click the check boxes to select as many of these options as you want, except that Interface Traffic and Interface CoS Traffic are mutually exclusive. They use the same interface traffic files for output, so you can only have one or the other.
Range Options
Click any one of the radio buttons to select that range. For Start Date and End Date, click in each of those fields to bring up the calendar or calendar/clock window. The Start Date and End Date formats are a little different, depending on what you choose for Series:
If Series = “Hour of day aggregation” or “Time Series”, the Start Date and End Date are specified as just the date because all hours of the specified days are used. A calendar window displays for you to select the date.
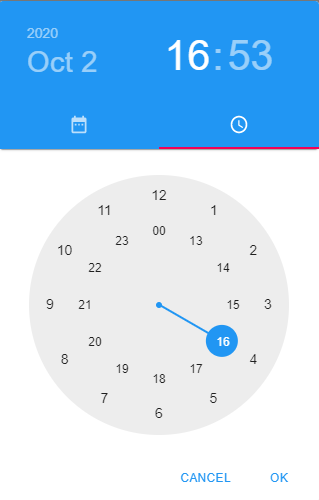
If Series = “Time Series - Hourly”, the Start Date and End Date are specified as date and hour. In this case, a calendar/clock window displays, with calendar and clock icons for selecting the date and the hour, respectively. Note that it is a 24-hour clock as shown in Figure 2.
Figure 2: Calendar and Clock Icons in the Calendar/Clock Window
Series Options
Three options are available for Series:
Hour of day aggregation
In this type of series, all measurements are aggregated by hour of day, potentially across multiple days. For example, by specifying “last week”, you would get the average or 90 percentile traffic for 9 – 10 PM. All measurements between 9 and 10 PM from all seven days would be considered in the calculation of the statistics. This is useful for calculating a typical day across a date range. Each parameter would have 24 values in the resultant traffic file, corresponding to each hour in the typical day. The usefulness of this series type diminishes as the time range becomes longer because the impacts of traffic trend over the time range would skew the statistic to represent either the time range mid-point or end-point for average and 90 percentile statistics, respectively.
Time Series
When you select Time Series, an additional Interval field is displayed. One data point per the specified interval (1 day, 1 week, or 1 month) between the selected start and end dates is used. How you set your range and interval will determine the number of data points. For example, if you do daily statistic calculations for 24 days, you would have 168 data points. If you were interested in a time series for four months of data, you might want to use a courser interval such as weekly.
Time Series - Hourly
Time Series – Hourly is a variation of Time Series that specifically uses one hour as the interval. One data point per hour is used, for the duration of the date range you specify.
Statistic Options
Use the drop-down menu to select from the two traffic statistics options offered. The two options enable different objectives in modeling:
Average: Provides a representation of the typical traffic during a period.
90 percentile: Provides a representation of peak traffic during a period.
For recent time ranges (last day or week), there might not be a large difference in these values for hourly interval time series or hour of day aggregation. For daily or larger intervals, 90 percentile might be a better choice for capacity planning.
Output Directory and Output Runcode
The output directory is /opt/northstar/data/network_archive .
The output runcode defaults to the current model’s runcode.
Load New Data
If you select “Load new data” in the Traffic Aggregation window, the extracted performance files are read into the current model and displayed in the network information table in columns that are only shown once traffic aggregation data is available. In the Tunnel and Demand tabs, the results are displayed in the Traffic column. In the Interface tab, the results are displayed in the Ingress Traffic and Egress Traffic columns. Figure 3, Figure 4, and Figure 5 show examples.


