Main Window Overview
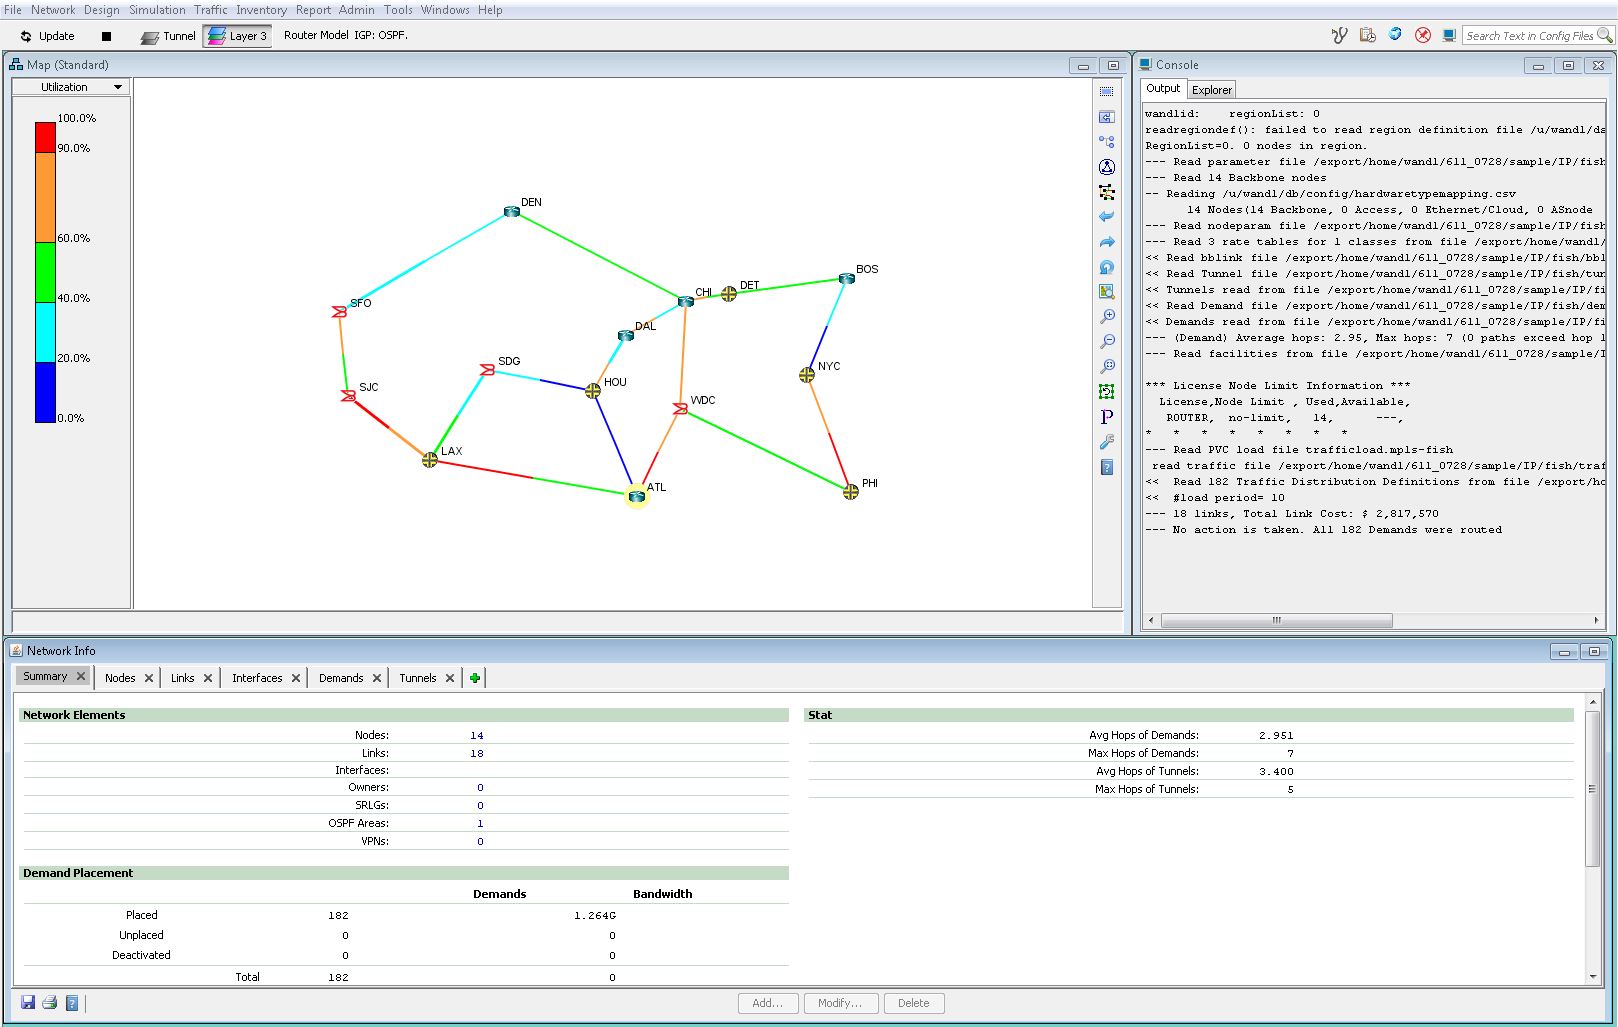
This topic explains the functions of the main window, the workspace from which all NorthStar Planner windows are launched or opened. In addition, it discusses the File menu of the menu bar. Figure 1 shows the main window, displayed when a network is launched.

The main window consists of the following elements: Menu, Toolbar, Topology, Console, and Network Info window. Note that many functions and features do not become available until a network is loaded. This includes some of the menus as well as the topology window.
Menu options may vary depending on your user permissions, or modules.
File |
The File menu contains network file functions such as creating, opening, saving, loading files, and closing the network. |
|
Network |
The Network menu provides comprehensive details on network elements, such as nodes, links, interfaces, demands, and tunnels. Detailed information on services, protocols, and paths. Alternative Maps such as BGP. |
|
Design |
The Design menu provides options to design the network’s backbone through new or incremental designs for the backbone links. Design also enables functions such as path placement, path diversity design, and tuning. |
|
Simulation |
The Simulation menu provides options to run scripted and interactive failure scenarios for nodes, links, sites, and facilities, to test the network’s resiliency and discover worst-case scenarios. |
|
Traffic |
The Traffic menu is used to access traffic-related features such as Traffic Load, Trending, Growth, and Traffic Aggregation. |
|
Inventory |
The Inventory menu is used to access hardware inventory reports and hardware equipment cost tables. |
|
Report |
The Report menu is used to access the Report Manager which contains detailed network, tunnel, simulation, configuration, and user customized reports. |
|
Admin |
The Admin menu is used to access the Task Manager, Device Library, and User Administration. These functions are normally used by network administrators or NorthStar Planner administrators. |
|
Tools |
The Tools menu contains settings and tools: Compliance Assessment, CAT Template Design, VPN Traffic Generation, and Options. |
|
Windows |
The Windows menu lists all sub-windows currently open in NorthStar Planner. |
|
Help |
The Help menu contains a link to help documentation, information about the system, and the Message of the Day. |

The toolbar contains the following items:
Update button to update the status and routing on the network after you have made changes to the network.
Stop button to cancel simulation runs or T-Solve processing.
Two network layer buttons for MPLS-enabled router networks: Tunnel, Layer 3
Description of the network model
Integrity Checks shortcut
Task Manager shortcut
Provisioning Manager shortcut
Console shortcut
Configuration File search bar to search for text in the configuration files of the currently opened network.
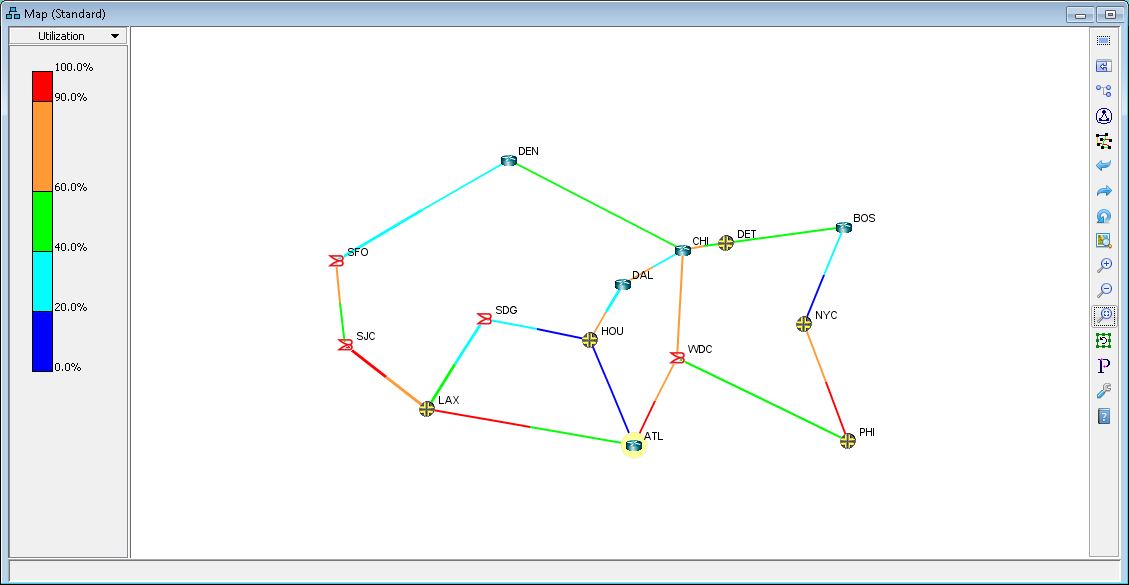
Topology Map
The topology map, or Map (Standard), is the main work area in NorthStar Planner and displays important link and node properties. Links are color-coded according to a specified link property such as media type, trunk type, or vendor. By default, the links are displayed by link utilization. Nodes are color-coded by icons and symbols.
For more information on how to select and move nodes, label nodes, and access network information properties through right-click popup menus, refer to Topology Window Overview.


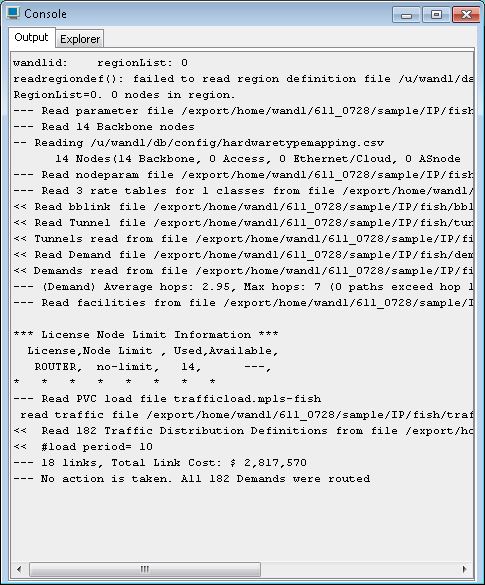
The console displays additional information when loading the network, reading files, running failure simulation, generating reports, performing path trace, creating designs, and various other functions. The console can be used to trace through information in more detail.
Right-click in the console window to access further functions such as copying text, searching for text in the console, saving the output, or creating a trace file of the console output.
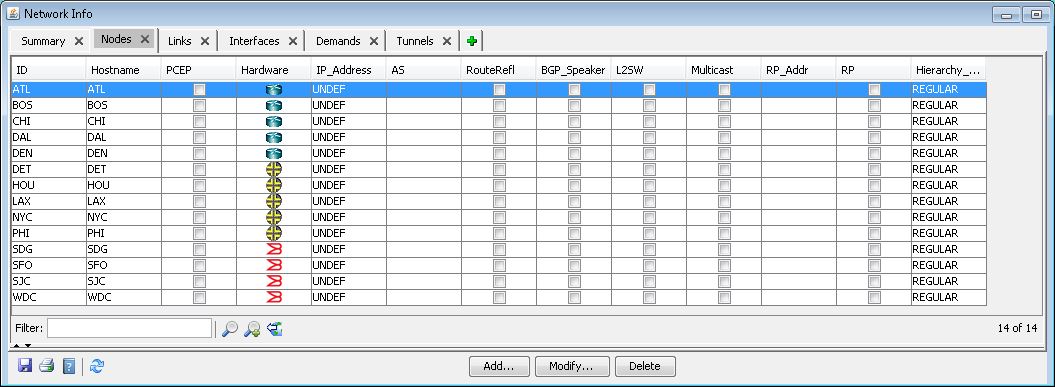
The Network Info window contains network summary information and detailed information on nodes, links, interfaces, demands, and tunnels. Within each element tab, the element information can be searched, filtered, or modified for network what if studies. Additional elements may be available in this window depending on the network model.

