Viewing Analytics Data in the Web UI
There are views and work flows in the web UI that support visualization of collected data so it can be interpreted and acted upon.
Data collectors must be installed and devices must be configured to push the data to the data collectors. The health monitoring feature also uses information from the data collectors.
To view information about installed data collectors, navigate to Administration > System Health.
Analytics Widgets View
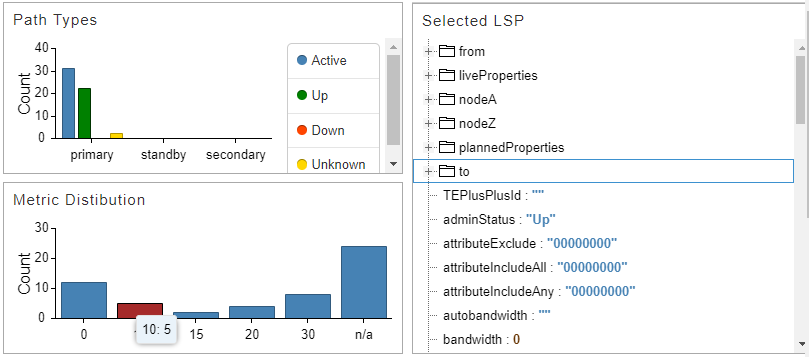
There are a number of widgets related to collected analytics data available when you click the Analytics option in the top navigation bar. The network information table is displayed along with the analytics widgets. Some of the widgets can display information specific to one or more tunnels you select in the table. Figure 1 shows a few examples of the widgets that are available.
Interface Utilization in Topology View
Interface Utilization is available as an option in the left pane of the topology view under Options. When selected, the amount of traffic (RSVP and other traffic) that is going though the network at the time is displayed in the topology, and is updated once every minute. This allows you to see how much traffic is going through the network as a function of time, as opposed to only being able to see reserved bandwidth.
Interface Utilization, RSVP Live Utilization, and RSVP Utilization are mutually exclusive. You can display only one of those three in the topology at a time.
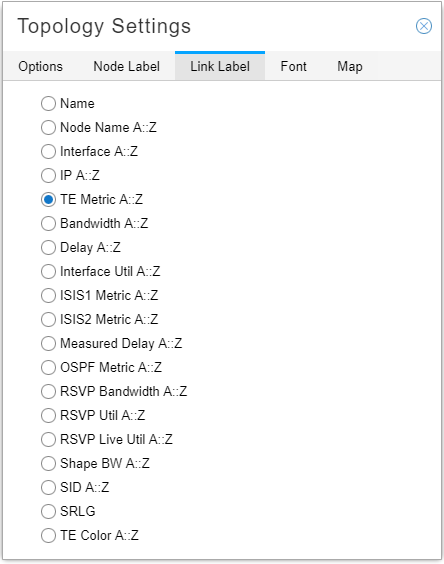
In the Topology Settings menu bar on the right side of the window, click the Tools icon and select the Link Label tab. You will see link label settings that pertain to interface utilization, as shown in Figure 2. The topology then displays the percentage utilization of the links in the format percentage AZ::percentage ZA. Additional labels are also available to display information that is collected through a Netconf collection task, and is used by the analytics feature. Interface names, interface bandwidth values, and shape bandwidth values are some examples.
Reaching the Traffic Chart from the Topology or the Network Information Table
You can right-click a link in the topology and select View Interface Traffic to see traffic statistics over time for the link. In this chart, you can select to display one or both interfaces, adjust the time range, and select the units as bps or % (of the link bandwidth). You can also view LSP events on the right side of the chart. Double click an event to see event details. A bell icon in the chart indicates that one or more events took place. Click a bell to filter the list of events on the right to include only those that occurred at that timestamp. Figure 3 shows the traffic view chart.

The events displayed are only those pertaining to the LSPs currently routed through the link being viewed, as opposed to all events for all LSPs in the network.
You can also reach this traffic-over-time view by right-clicking a link in the network information table (Link tab) and selecting View Interface Traffic. To see LSP traffic over time, click the Tunnel tab in the network information table. Right-click on an LSP and select View LSP Traffic. You can choose multiple objects at a time if you want to compare them. The top portion of the chart shows traffic over time. The bottom portion shows packets over time.
Also available by right-clicking a link in either the topology or the network information table are the options to View Link Events and View Interface Delay.
Interface Delay in Topology View
In the Topology Settings menu bar on the right side of the window, click the Tools icon and select the Link Label tab. You can opt to display live interface delay measurements on the topology map by Measured Delay A::Z. Select Performance in the left pane drop-down menu in Topology View, and select Interface Delay to display planned delay data in the topology map.
Interface delay information is only available if the devices have been prepared:
RPM probes have been configured.
The rpm-log.slax script has been loaded, to send the results of the probes to the data collectors.
Note:The NorthStar Controller does not automate the installation of this script on the router. You must install the script manually.
Graphical LSP Delay View
To view graphical LSP delay information for tunnels in the web UI, you must enable the functionality. The functionality is not enabled by default due to the possible impact on performance. Enabling the functionality allows PCViewer to calculate LSP delay and display the data in the web UI.
At any given time, the NorthStar Controller is aware of the paths of all LSPs in the network. Periodically, the controller uses the reported link delays to compute the end-to-end LSP delay as the simple sum of all link delays in the LSP path.
To enable the functionality, access the NorthStar CLI as described in Configuring NorthStar Settings Using the NorthStar CLI. Set the number of seconds using the set northstar path-computation-server lsp-latency-interval command.
For example, # set northstar path-computation-server lsp-latency-interval
20s.
Once the functionality is enabled, you can right-click a tunnel in the network information table in Topology view and select View Delay. The data is also available in the Tunnels view. Figure 4 shows the LSP delay view, using data for the Silver-102-104 LSP as an example.

Performance View
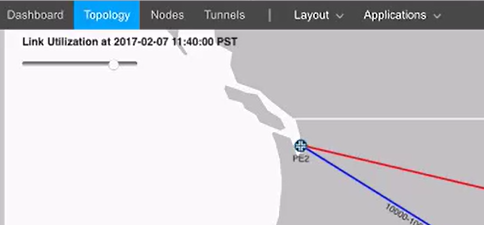
The Performance View shows you how utilization has changed over time. In the left pane of the topology view, select Performance from the drop-down menu. If you click the Interface Utilization check box, for example, and then move the slide bar in the upper left corner of the topology map, you see the link colors change to reflect the utilization at the time. Interface utilization is calculated using Layer 3 bandwidth (interface utilization = Layer 3 traffic divided by Layer 3 bandwidth). This is different from RSVP bandwidth which is initialized via BGP-LS and automatically adjusted. The two bandwidth values (RSVP and Layer 3) can be the same, but in some networks, they are not. Figure 5 shows the location of the slide bar.
Node Ingress Traffic, Node Egress Traffic, and Interface Delay are also available, in addition to Interface Utilization. In the case of Node Ingress and Node Egress Traffic, the size of the node on the map is proportional to the amount of traffic being handled by the node. Ingress and egress traffic for a node are not always equal. Generally, most traffic is simply forwarded by a router (as opposed to being generated or consumed), so it might seem reasonable to expect that the sum of all ingress traffic would be roughly equal to the sum of all egress traffic. But in practice, nodes can replicate traffic, as is commonly the case for multicast traffic or unknown unicast traffic when doing L2 Ethernet forwarding. In such cases, the total egress traffic can (and should) exceed the total ingress traffic.
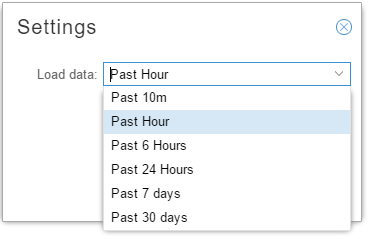
For all four options (Node Ingress Traffic, Node Egress Traffic, Interface Delay, Interface Utilization), the Settings button at the bottom of the left pane allows you to select how far back you want the data to show, with options up to 30 days back. Figure 6 shows these options.
Nodes View
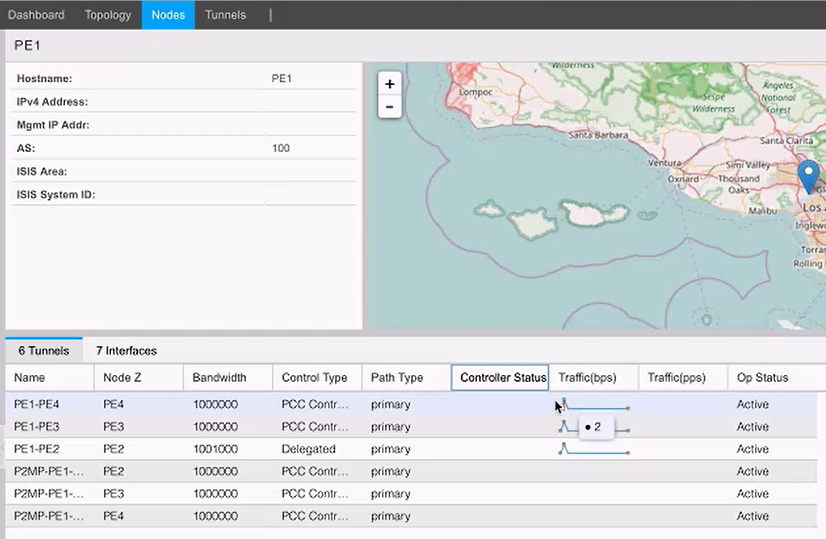
Two columns of data in the Nodes View reflect a snapshot of traffic in bps and pps over the last hour. This is for quick reference in case there are conditions that require attention. You can see this snapshot for both Interfaces and Tunnels. Figure 7 shows these two columns.
Interface Protocols Display
Data collection allows the NorthStar Controller to gather information about the protocols that are configured on each interface. The Protocols column in the network information table under the Interface tab displays OSPF, LDP, RSVP, and MPLS when configured. Be sure you have selected this column to be included in the display.
Displaying Top Traffic
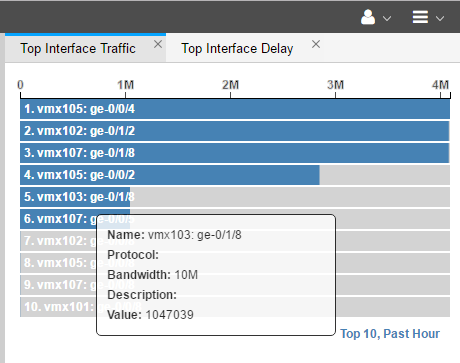
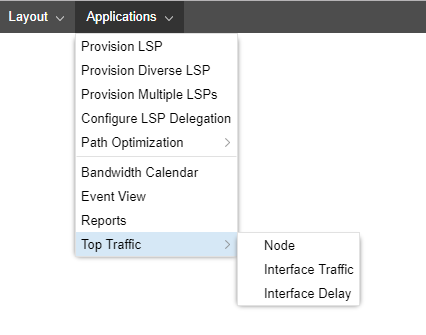
You can display the recent top traffic by navigating to Applications > Top Traffic as shown in Figure 8.
Top traffic is the computed top N traffic over X period of time by Node, Interface Traffic, or Interface Delay. You can select N and X by clicking on the currently selected values in the lower right corner of the display as shown in figx. In the resulting Top Traffic Settings window, you can select the number of top elements you want to see, and the period of time they cover. Figure 9 shows Top Interface Traffic with the top 10 elements over the past hour displayed. To modify the settings in this example, you would click on Top 10, Past Hour at the bottom of the display, which would bring up the Top Traffic Settings window where you could make different setting selections.
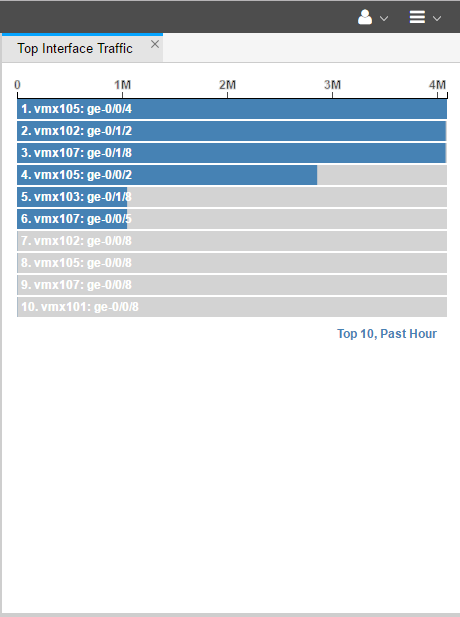
You can select any or all of the top traffic options (Node, Interface Traffic, Interface Delay) to be included in the display. Multiple selections appear as tabs that you can toggle between. There is interactivity between the topology map and the top traffic charts: you can select a line item on the chart and it will highlight the corresponding object on the topology map. You can also mouse over a line item on the chart to display details about the object as shown in Figure 10.
