Support for Cisco Model Driven Telemetry
NorthStar Controller supports Cisco Model Driven Telemetry (MDT) as an alternative to SNMP collection of interface and LSP traffic data for Cisco devices. SNMP collection is relatively slow (polling intervals greater than five minutes) and costly. NorthStar’s MDT Collector performs network monitoring by continuously processing telemetry streams from the Cisco devices in the network.
SNMP collection in NorthStar Controller is enabled by creating an SNMP collection task in the Task Scheduler (Administration > Task Scheduler). If you want to use MDT for data collection on the Cisco devices in the network, and SNMP collection for other devices in the network, you can create an SNMP collection task that specifies selected devices or device groups for inclusion, and deselects those that support MDT. See Data Collection Using SNMP for more information about SNMP collection tasks.
You should not have both SNMP collection and MDT enabled for the same devices.
The NorthStar MDT Collector is described in the following sections:
How it Works
The MDT Collector is provided as part of the NorthStar Analytics RPM bundle and resides on the Analytics node. Supervisord manages the MDT Collector process as part of the Analytics Supervisord group.
Pipeline, as a third party component, is installed in /opt/northstar/thirdparty/pipeline. The pipeline logfile resides in /opt/northstar/logs/pipeline.msg.
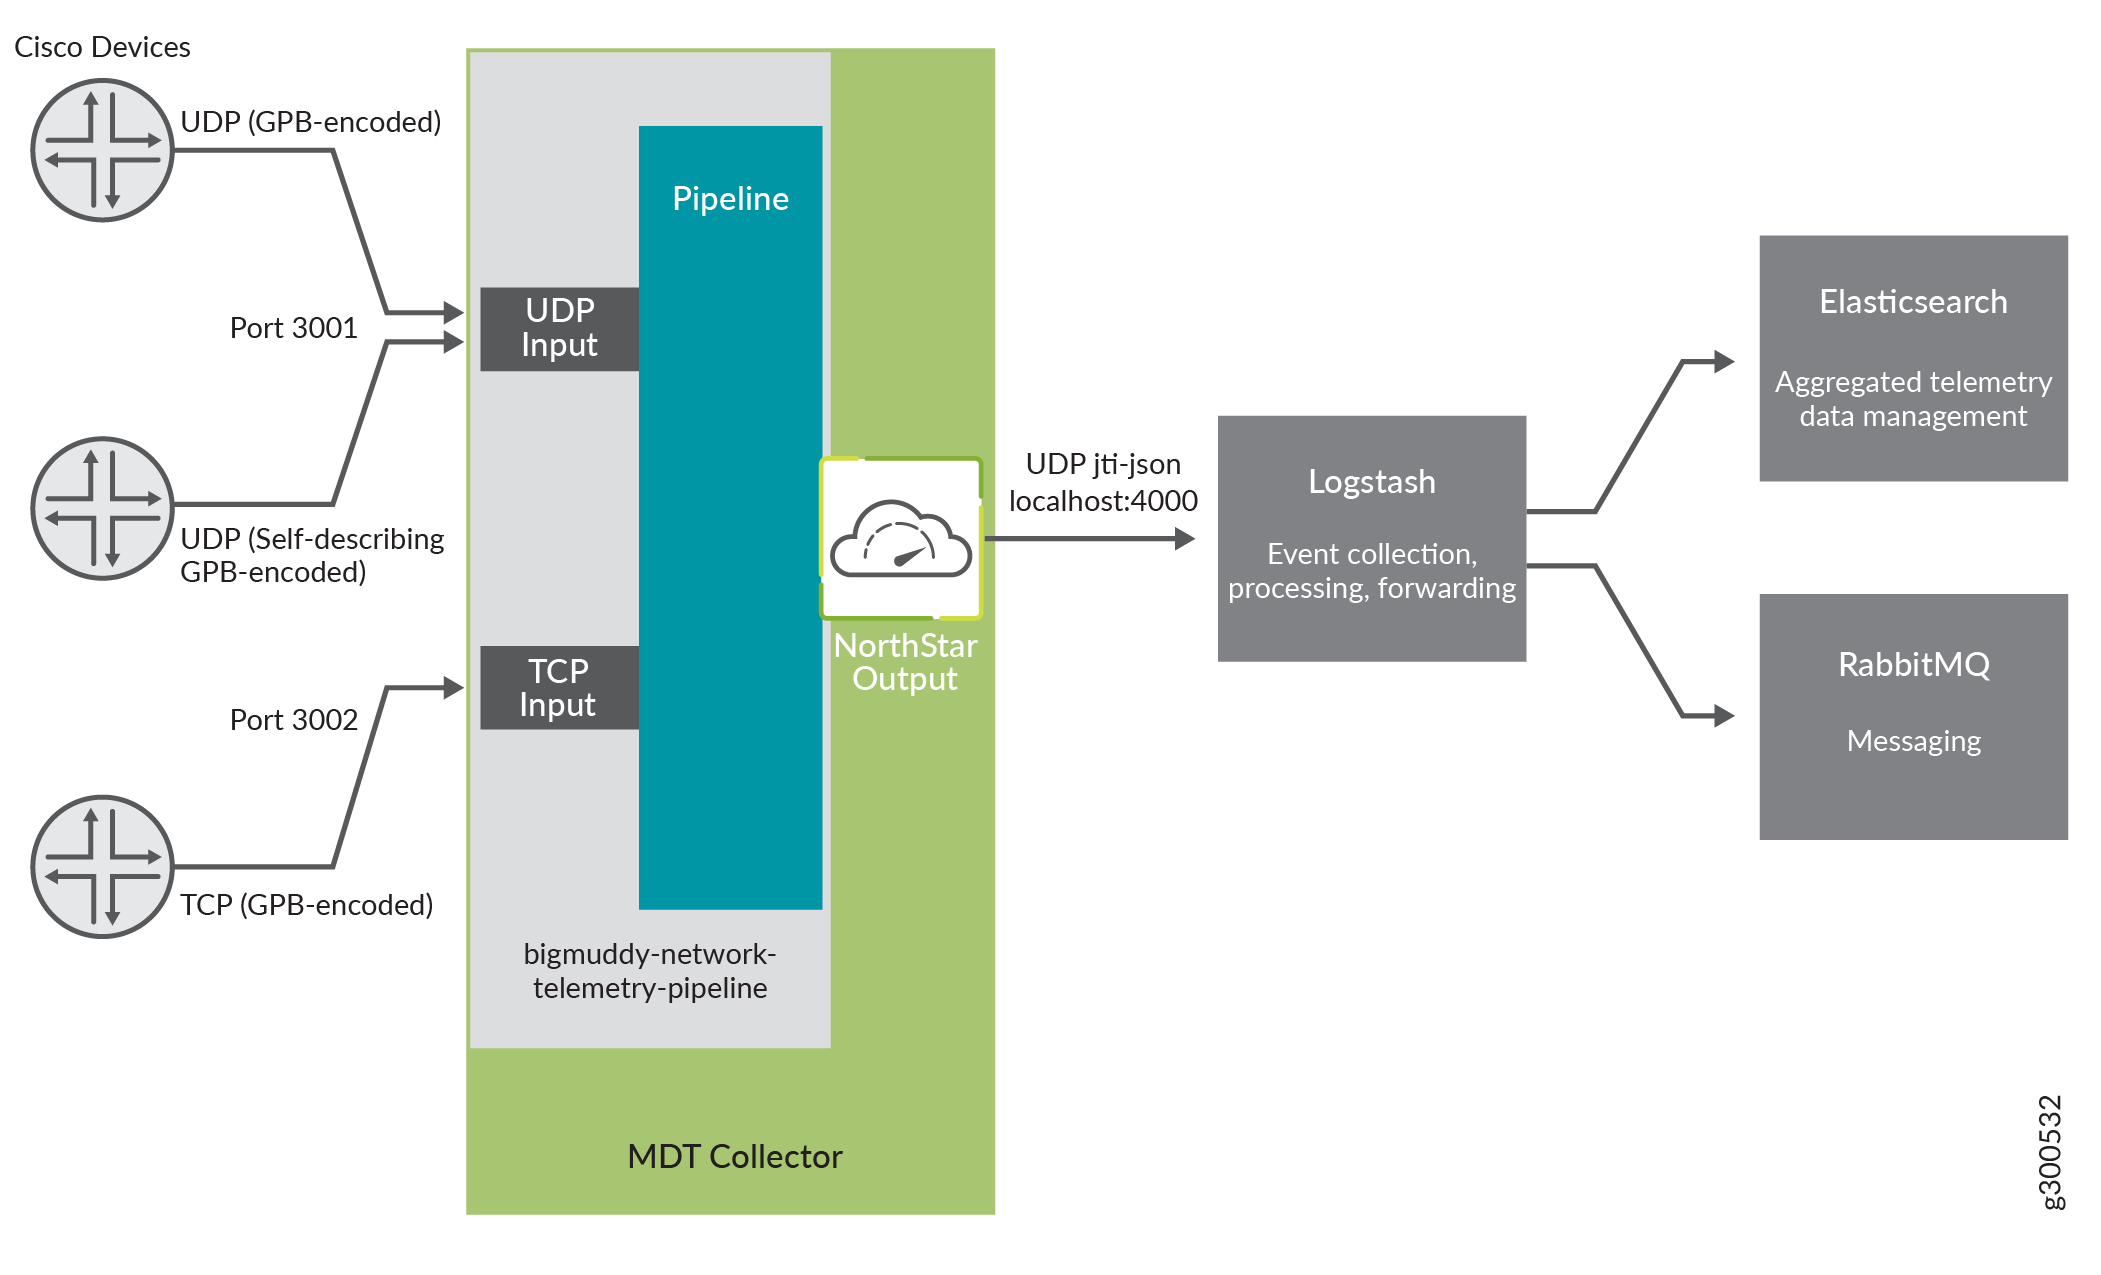
Figure 1 illustrates the general data flow when using MDT.

Here’s an overview of the process:
The MDT Collector consists of the bigmuddy-network-telemetry-pipeline (open source) and NorthStar’s output plugin. The pipeline’s configuration file (pipeline.yml) resides in /opt/northstar/data/pipeline/config.
Streaming of the MDT data is initiated by the router.
The scope and schedule of the streams is in accordance with the configuration on the devices.
Note:IOS-XR devices must be running release XR 6.1.1 or higher.
NorthStar MDT supports UDP and TCP transport protocols. For encoding, it supports GPB, self-describing GPB (KV-GPB), and JSON.
When the pipeline receives the telemetry data via UDP or TCP, it decodes the data and pushes it to the NorthStar output plugin for processing. This happens inside the MDT Collector.
The NorthStar plugin converts the data into JTI format, encodes it as a JSON document and pushes it out of the MDT Collector to Logstash via UDP.
Logstash processes the JSON document and then pushes the information to Elasticsearch and RabbitMQ for use by NorthStar Controller.
The NorthStar components retrieve the traffic data by leveraging the NorthStar REST API.
Configuring MDT in NorthStar
The only MDT parameter to configure directly in NorthStar has to do with the starting log level. By default, NorthStar starts the MDT component at “info” log level. You can modify the level to "debug" if you prefer by accessing the cMGD CLI as described in Configuring NorthStar Settings Using the NorthStar CLI. Use the cMGD command set northstar analytics model-driven-telemetry log-destination destination-name level log-level
The debug logs are written into the file /opt/northstar/logs/pipeline.log unless you configure a different destination name.
When you change the log level, you must restart pipeline:
supervisorctl restart analytics:pipeline
Configuring MDT on IOS-XR Devices
MDT must be configured on the IOS-XR devices for which you intend to collect data. A sample configuration is shown here, but consider your Cisco documentation the definitive source of IOS-XR configuration information.
telemetry model-driven

 destination-group Northstar

  address-family ipv4 collector-address port port

   encoding gpb | self-describing-gpb

   protocol tcp | udp

  !

 !

 sensor-group mdt

  sensor-path
Cisco-IOS-XR-infra-statsd-oper:infra-statistics/interfaces/interface/latest/generic-counters
sensor-path
Cisco-IOS-XR-mpls-te-oper:mpls-te/signalling-counters/head-signalling-counters/head-signalling-counter

 subscription mdt

  sensor-group-id mdt sample-interval 60000

  destination-id Northstar

 !

!
Some notes about this configuration:
The collector-address variable refers to the system (analytics node) where the MDT collector is running.
The encoding choice (gpb or self-describing-gpb) does not affect the “encap” setting within the tcp_northstar or udp_northstar section.
If you configure TCP as the protocol, the port value in the IOS-XR MDT configuration must match the port setting in the pipeline configuration. Look for the listen parameter in the tcp_northstar section in /opt/northstar/data/pipeline/config/pipeline.yml. If you configure UDP as the protocol, the port value must match that in the udp_northstar section.
The sample-interval setting (milliseconds) specifies how frequently telemetry streams are sent out.
The sensor-path Cisco-IOS-XR-mpls-te-oper:mpls-te/signalling-counters/head-signalling-counters/head-signalling-counter statement directs the device to collect and report the tunnel names and signal-names to the MDT Collector.
Using the sensor-path configuration, you can filter based on specified criteria. For example, to report the statistics for tunnel-te interfaces (created for LSPs):
sensor-path Cisco-IOS-XR-infra-statsd-oper:infra-statistics/interfaces/interface
[interface-name='tunnel-te*']/latest/generic-counters
