Link Latency Collection
You can collect link delay statistics using Link Latency collection tasks that use a ping operation (Juniper Networks and Cisco devices).
When a link latency collection task is run, the collector issues a ping from one device to the endZ address of all links to gather round trip time (RTT) statistics. The RTT is the amount of time in milliseconds from when the ping packet is sent to the time a reply is received. The minimum, maximum, and average RTT is calculated based on multiple pings.
You must run device collection before attempting to run link latency collection. This is necessary to establish the baseline network information including the interfaces and LSPs. Once device collection has been run, link latency collection tasks have the information they need.
To schedule a new link latency collection task, navigate to Administration > Task Scheduler from the More Options menu.
Click Add in the upper right corner. The Create New Task window is displayed as shown in Figure 1.
Figure 1: Create New Task Window
Enter a name for the task and use the drop-down menu to select the task type as Link Latency. Click Next.
In the next window, enter the number of times you would like the ping operation to repeat.Figure 2 shows this window.
Figure 2: Device Collection Task, Step 2 for Link Latency Collection
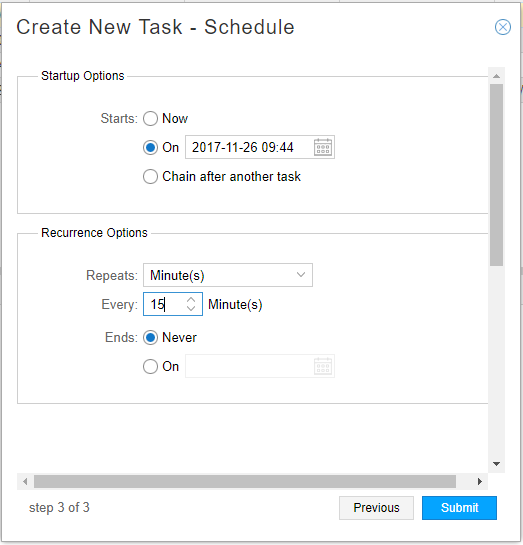
Click Next to proceed to the scheduling parameters. The Create New Task - Schedule window is displayed as shown in Figure 3. You can opt to run the collection only once, or to repeat it at configurable intervals. The default interval is 15 minutes.
Figure 3: Link Latency Collection Task, Scheduling
Instead of scheduling recurrence, you can select to chain the task after an already-scheduled recurring task, so it launches as soon as the other task completes. When you select the “Chain after another task” radio button, a drop-down list of recurring tasks is displayed from which to select.
Click Submit to complete the addition of the new collection task and add it to the Task List. Click a completed task in the list to display the results in the lower portion of the window. There are three tabs in the results window: Summary, Status, and History. An example of the Summary tab is shown in Figure 4. An example of the Status tab is shown in Figure 5.
Figure 4: Collection Results for Link Latency Collection Task, Summary Tab Figure 5: Collection Results for Link Latency Task, Status Tab
 Note:
Note:You can have only one link latency traffic collection task per NorthStar server. If you attempt to add a second, the system will prompt you to approve overwriting the first one.
