Event View
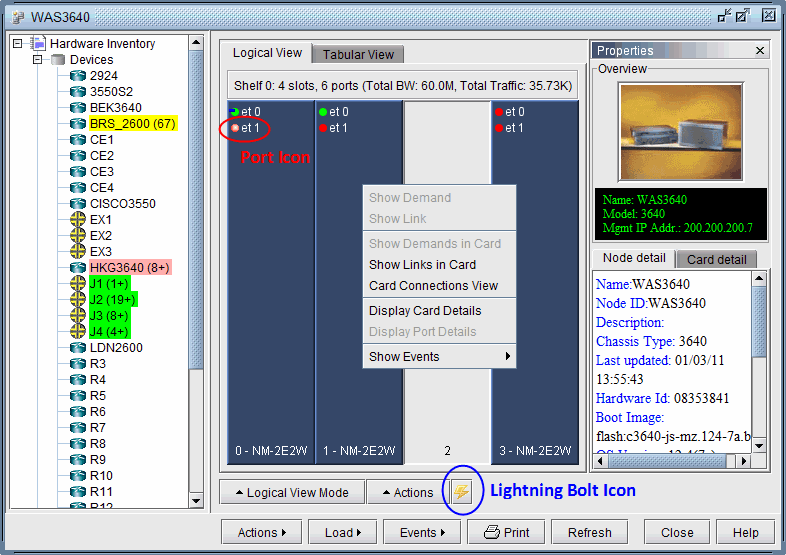
The Hardware Inventory window is capable of displaying hardware related event counts from the Live Network. This requires opening the Event Map before opening the Hardware Inventory window. Click the Events button and select the desired view. The event count appears in the left panel under Devices.
Show node event count always displays the total number of events.
Show updated event count only displays the number of new events since refreshing the hardware inventory window. Selecting a device will clear the counter.
Hide event count hides the event counters.
The number of events on each node are displayed against a background colored according to the Event Map severity legend. Note that some of the event counters are followed by a `+' symbol. In this case, the counter represents the number of events belonging to the worst severity category used for the background color and the `+' symbol indicates that there are additional events of lower severity not factored into this counter.
If a physical port goes down, the port icon will flash.
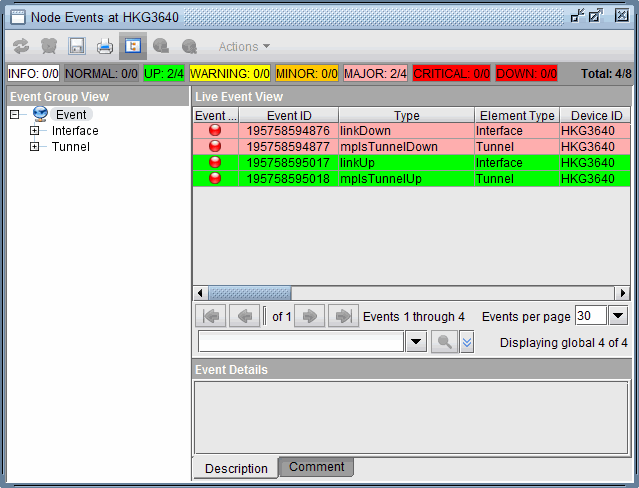
When new events occur, a lightning bolt icon will appear. Clicking on the icon opens a new window similar to Event Browser with the related events.

Right-clicking in the Logical View panel opens a pop-up menu to Show Events by node, card, or port. This opens a new window similar to Event Browser with only the events relevant to the device selected.

