Viewing Multicast Demands in the Network
-
At this point, a multicast group has been defined and demands, or flows, to the multicast group have been created. Now, information on these demands and how they fit into the network can be examined. First, switch to View mode. When the program asks whether or not to Update Demand Routing Tables, click Yes.
-
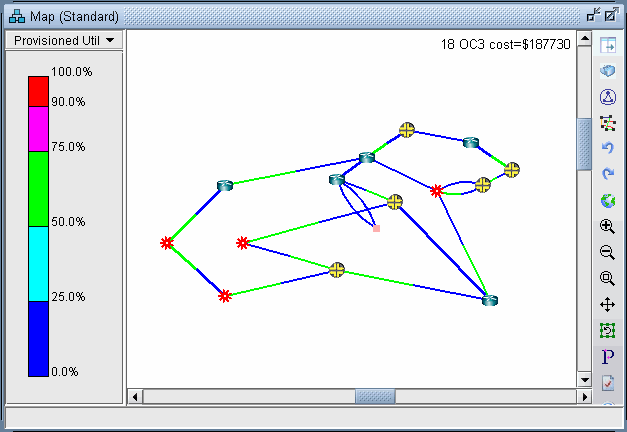
The first thing to notice is that, even though there are multiple recipients of the 100M flows from node SFO, the link utilization appears uniform throughout all the utilized links, as shown in Figure 1. This is typical of multicast networks and is a good example of the advantage of multicast over traditional unicast networks. In traditional unicast networks, one would expect “high” utilization near the source and “lower” utilization as the flows fan out to the recipients. Here, the utilization is “low” everywhere.
Figure 1: Link Utilization in a Multicast Network
-
Now, click on Network > Elements > Demands. The Demands window lists all the demands in the network, which in this example should all be multicast demands.
-
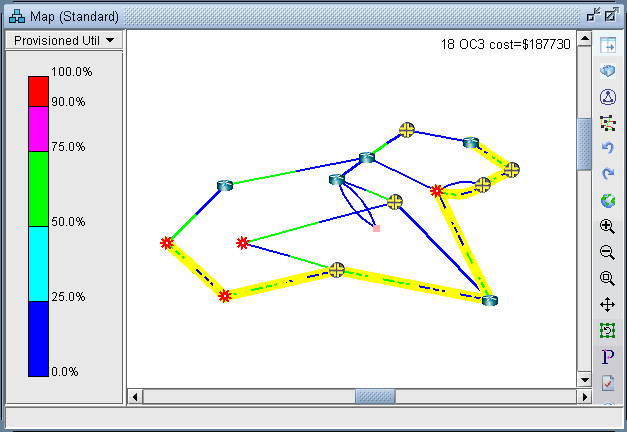
Highlight any of the rows in the demands table and click the Show Path button. This will display the path taken by the demand according to the unicast protocol being used. The default protocol is PIM-SM (Protocol Independent Multicast - Sparse Mode). This can be changed for each demand by modifying the demand’s Type field.
Figure 2: Path of a Demand from SFO to BOS
-
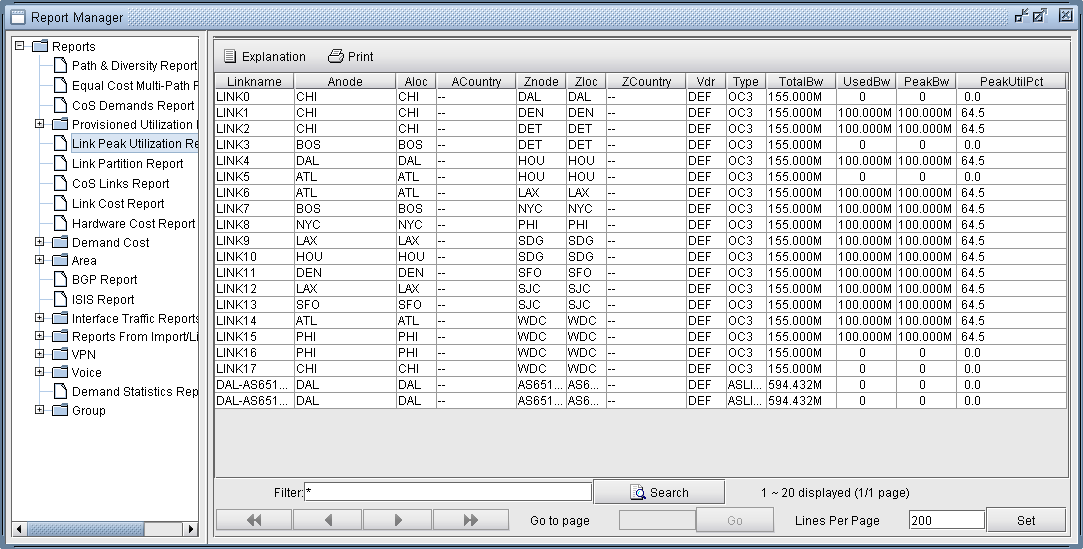
Detailed information on link utilization resulting from the multicast demands can be viewed through the Peak Link Utilization Report under Simulation Reports > Network StatisticsTo do this, click on Report > Report Manager, then select Peak Link Utilization from the list of reports in the Report Manager window. Notice in the example below that all the utilized links display a utilization of 100M.
Figure 3: Link Peak Utilization Report for a Multicast Network
-
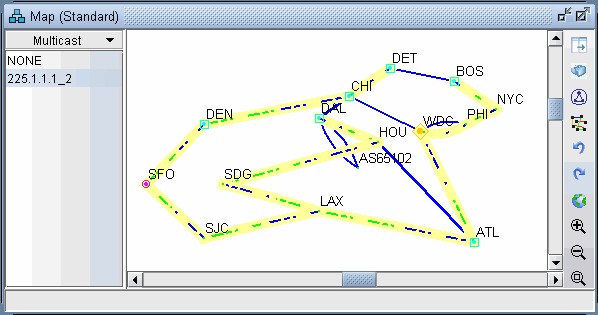
Select Subviews > Multicast from the map to view the multicast tree graphically.
Figure 4: Multicast Subview
-
Note the special icons used for the source (SFO), the Rendezvous Point (WDC) and the subscribers.
-
If there are multiple trees listed, you can <Ctrl>-click to highlight multiple trees at once. Each multicast tree will have a different color, e.g., yellow, green, blue. Overlaps between trees will also have a unique color, e.g., orange.
