Paragon Insights Overview
Paragon Insights is a highly automated and programmable device-level diagnostics and network analytics tool that provides consistent and coherent operational intelligence across network deployments. Paragon Insights integrates multiple data collection methods (such as Junos Telemetry Interface (JTI), NETCONF, system log [syslog], and SNMP), to aggregate and correlate large volumes of time-sensitive telemetry data, thereby providing a multidimensional and predictive view of the network. Additionally, Paragon Insights translates troubleshooting, maintenance, and real-time analytics into an intuitive user experience to give network operators actionable insights into the health of individual devices and of the overall network.
Main Components of Paragon Insights
Paragon Insights consists of two main components:
-
Health Monitoring, which enables you to:
-
View an abstracted, hierarchical representation of device and network-level health.
-
Define the health parameters of key network elements through customizable key performance indicators (KPIs), rules, and playbooks.
A playbook is a collection of rules. You can create a playbook and apply the playbook to a device group or a network group. For more information on rules and playbooks, see Paragon Insights Rules and Playbooks.
-
-
Root Cause Analysis (RCA), which helps you find the root cause of a device or network-level issue when Paragon Insights detects a problem with a network element.
Paragon Insights Health Monitoring
The Challenge
With increasing data traffic generated by cloud-native applications and emerging technologies, service providers and enterprises need a network analytics solution to analyze volumes of telemetry data, offer insights into overall network health, and produce actionable intelligence. Although telemetry-based techniques have existed for years, the growing number of protocols, data formats, and key performance indicators (KPIs) from diverse networking devices has made data analysis complex and costly. Traditional CLI-based interfaces require specialized skills to extract business value from telemetry data, creating a barrier to entry for network analytics.
How Paragon Insights Health Monitoring Helps
By aggregating and correlating raw telemetry data from multiple sources, the Paragon Insights Health Monitoring component provides a multidimensional view of network health that reports current status and projected threats to the network infrastructure and its workloads.
Health status determination is tightly integrated with the Paragon Insights RCA component, which can use system log data received from the network and its devices. Health Monitoring provides status indicators that alert you when a network resource is currently operating outside a user-defined performance policy. Health Monitoring does a risk analysis using historical trends and predicts whether a resource may become unhealthy in the future. Health Monitoring not only offers a fully customizable view of the current health of network elements, but also automatically initiates remedial actions based on predefined service level agreements (SLAs).
Defining the health of a network element, such as broadband network gateway (BNG), provider edge (PE), core, and leaf-spine, is highly contextual. Each element plays a different role in a network, with unique KPIs to monitor. Because there's no single definition for network health across all use cases, Paragon Insights provides a highly customizable framework to allow you to define your own health profiles.
Paragon Insights Root Cause Analysis
The Challenge
For some network issues, it can be challenging for network operators to determine what caused a networking device to stop working properly. In such cases, an operator must consult a specialist (with knowledge built from years of experience) to troubleshoot the problem and find the root cause.
How Paragon Insights RCA Helps
The Paragon Insights RCA component simplifies the process of finding the root cause of a network issue. RCA captures the troubleshooting knowledge of specialists and has a knowledge base in the form of Paragon Insights rules. These rules are evaluated either on demand by a specific trigger or periodically in the background to ascertain the health of a networking component (such as routing protocol, system, interface, or chassis) on the device.
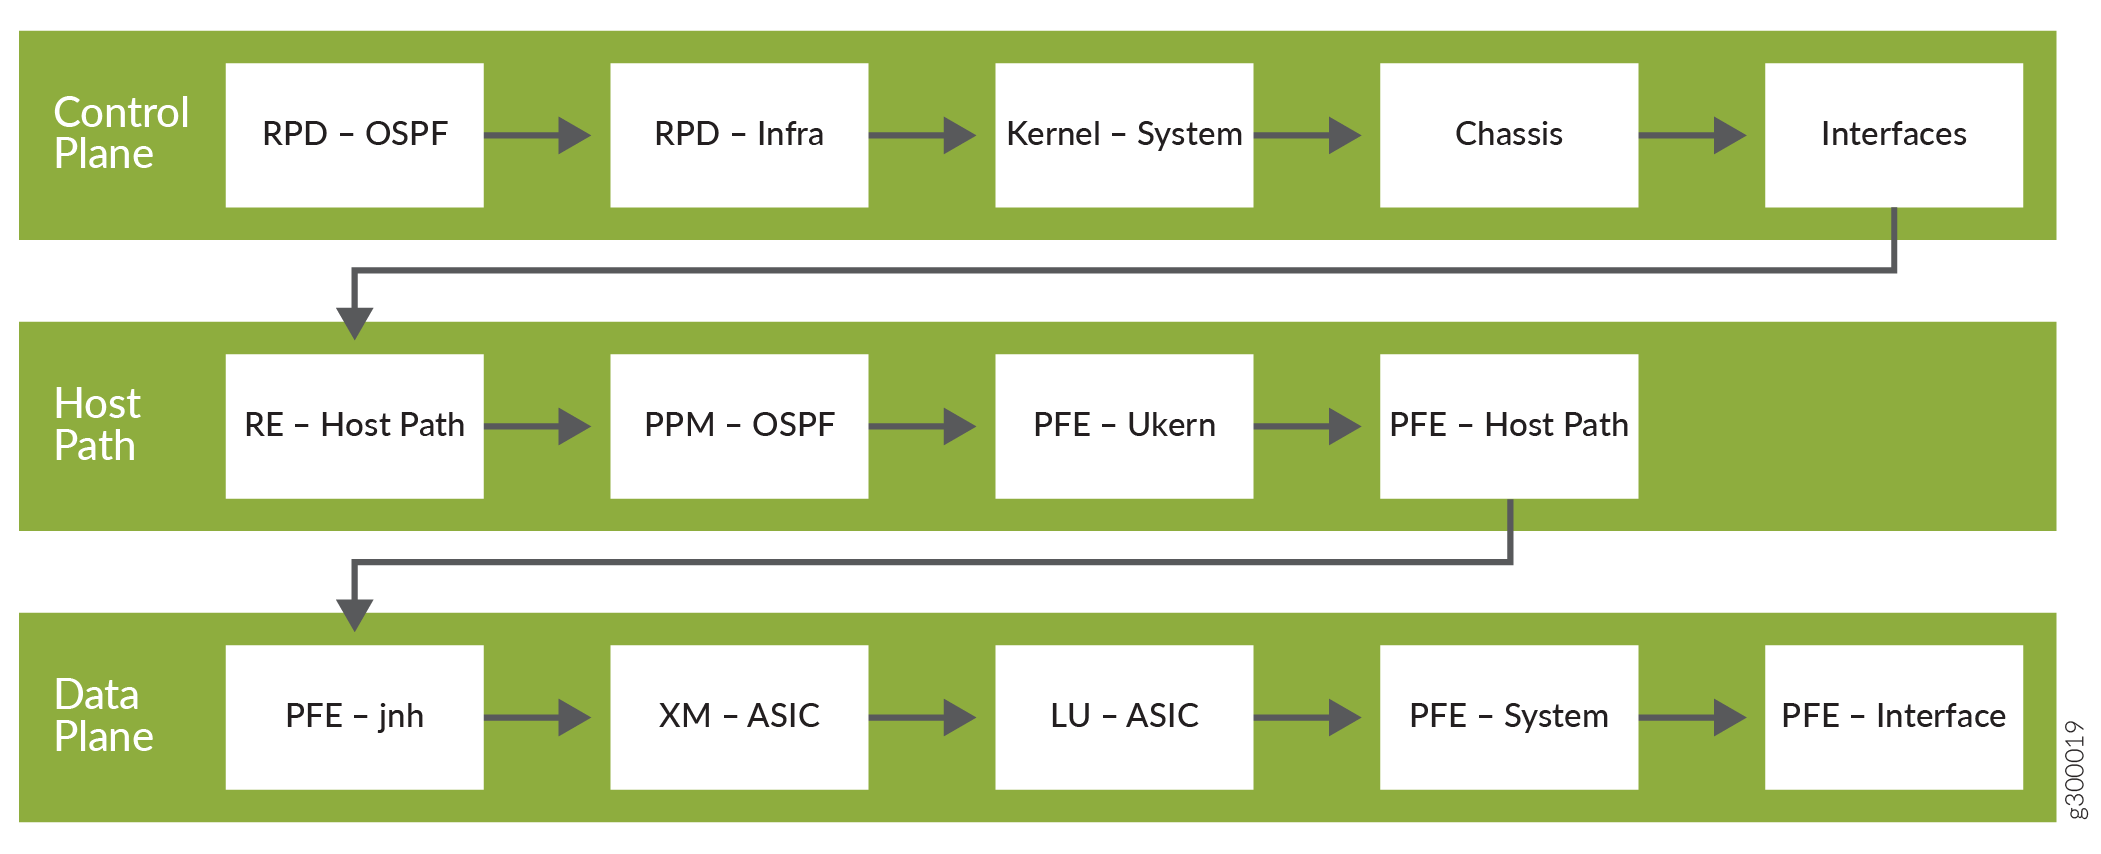
To illustrate the benefits of Paragon Insights RCA, let’s consider the problem of OSPF flapping. Figure 1 highlights the workflow sequence involved in debugging OSPF flapping. A network operator troubleshooting this issue would need to perform manual debugging steps for each tile (step) of the workflow sequence in order to find the root cause of the OSPF flapping. On the other hand, the RCA component troubleshoots the issue automatically by using an RCA bot. The RCA bot tracks all of the telemetry data collected by Paragon Insights and translates the information into graphical status indicators (displayed in the Paragon Insights web GUI) that correlate to different parts of the workflow sequence shown in Figure 1.

When you configure Paragon Insights, each tile of the workflow sequence (shown in Figure 1) can be defined by one or more rules. For example, the RPD-OSPF tile could be defined as two rule conditions: one to check if "hello-transmitted" counters are incrementing and the other to check if "hello-received" counters are incrementing. Based on these user-defined rules, Insights provides status indicators, alarm notifications, and an alarm management tool to inform and alert you of specific network conditions that could lead to OSPF flapping.
By isolating a problem area in the workflow, RCA proactively guides you in determining the appropriate corrective action to take to fix a pending issue or avoid a potential one.
Closed-Loop Automation
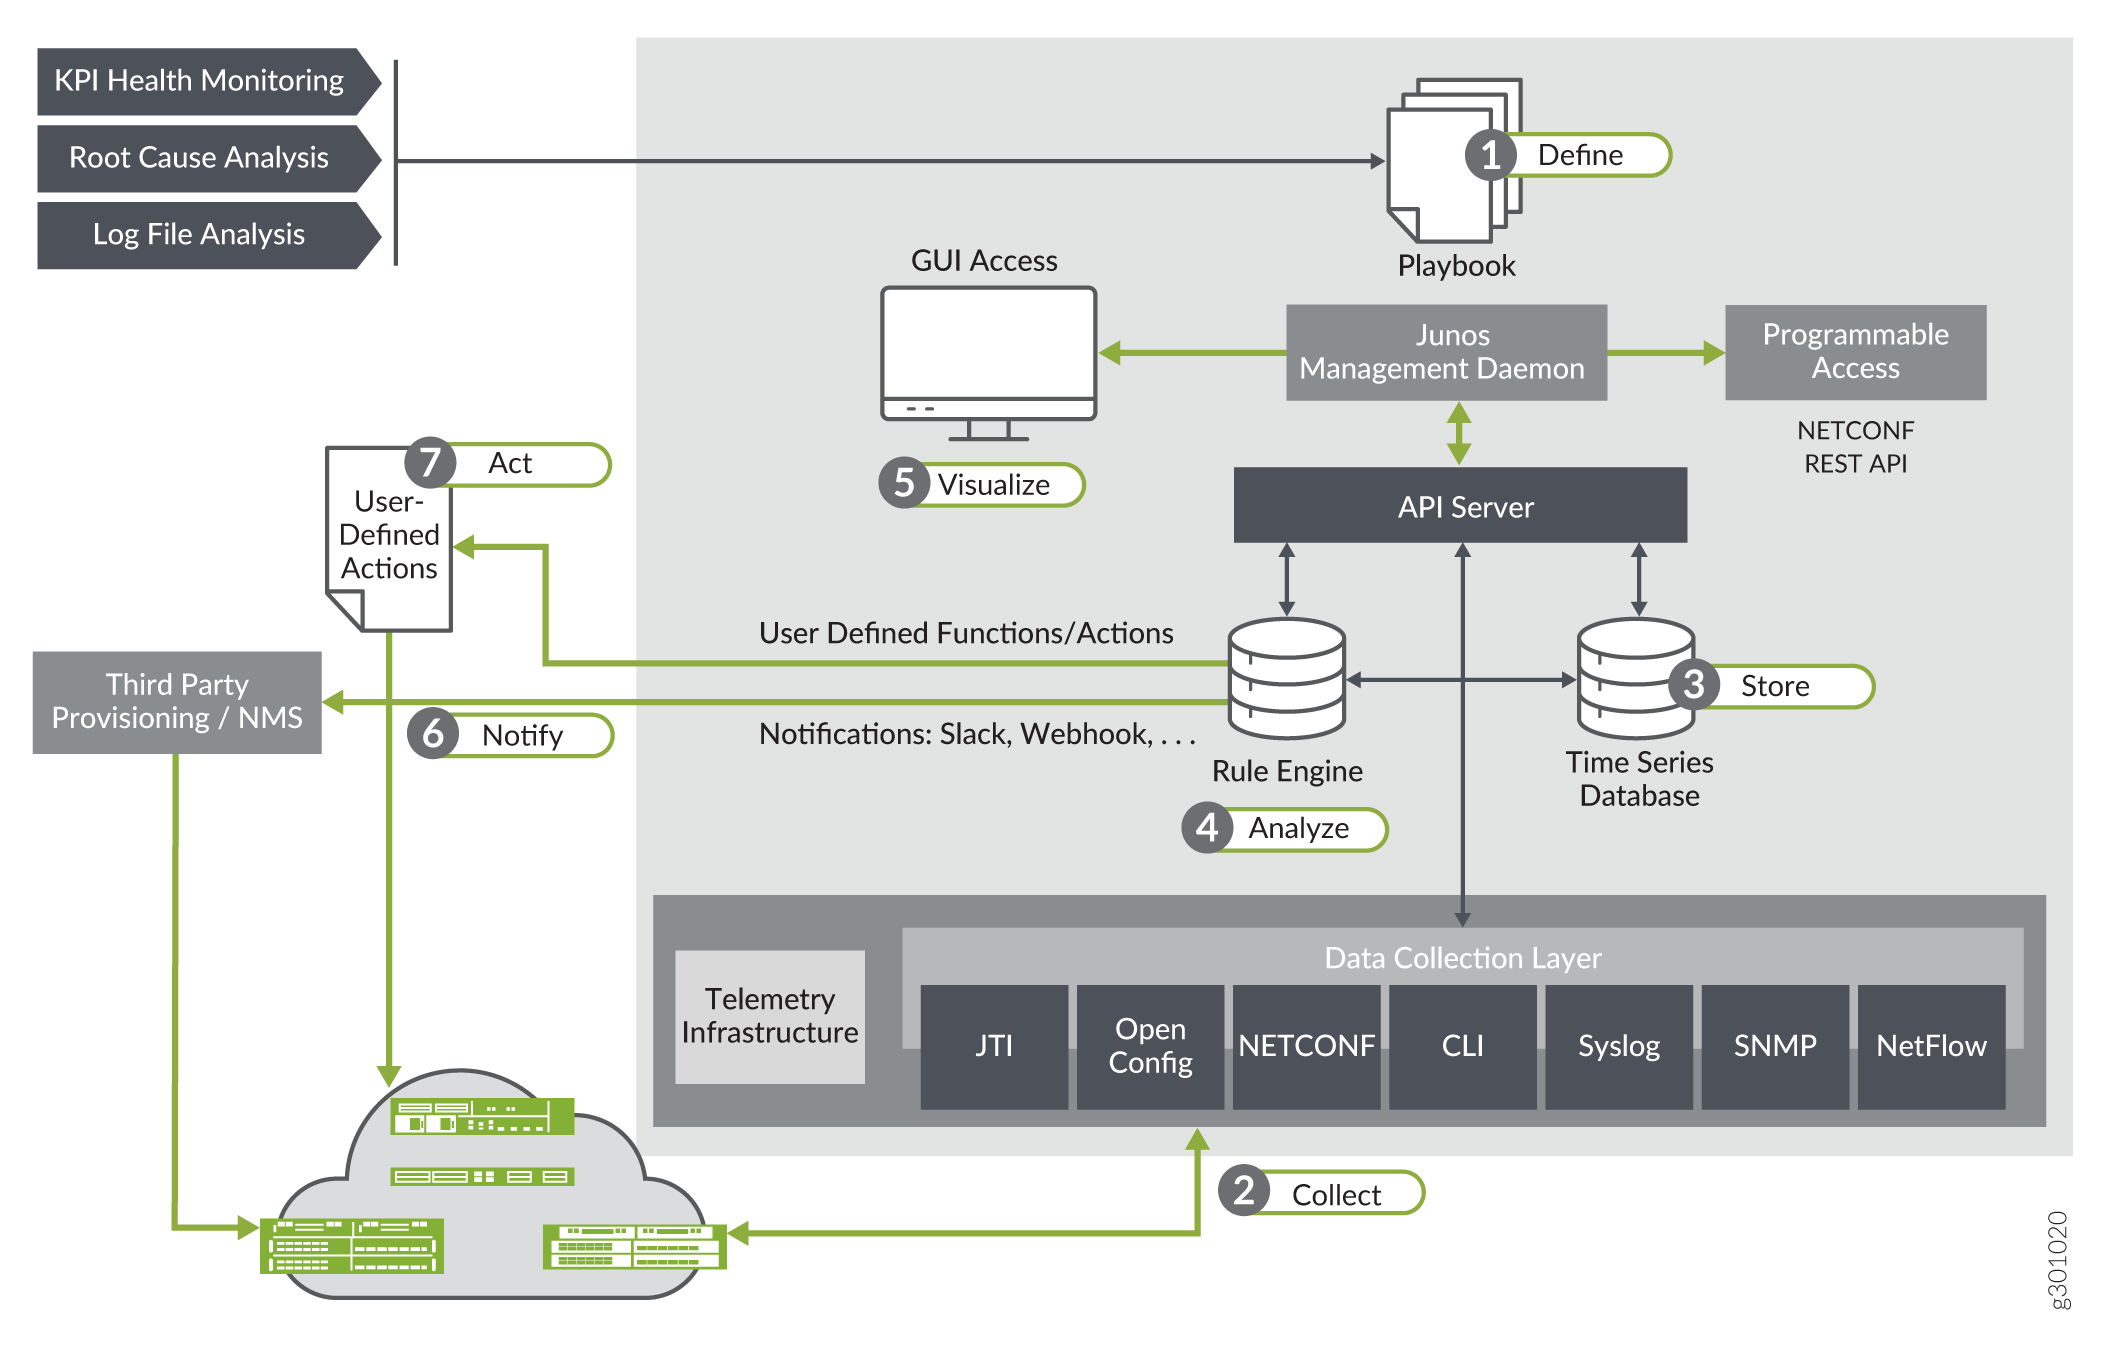
Paragon Insights offers closed-loop automation. The automation workflow can be divided into seven main steps (see Figure 2):
-
Define—The user defines the health parameters of key network elements through customizable KPIs, rules, and playbooks, by using the tools provided by Paragon Insights.
-
Collect—Paragon Insights collects rule-based telemetry data from multiple devices using the collection methods specified for the different network devices.
-
Store—Paragon Insights stores time-sensitive telemetry data in a time-series database (TSDB). This allows users to query, perform operations on, and write new data back to the database, days, or even weeks after the initial storage.
-
Analyze—Paragon Insights analyzes telemetry data based on the specified KPIs, rules, and playbooks.
-
Visualize—Paragon Insights provides multiple ways for you to visualize the aggregated telemetry data (through its web-based GUI) to gain actionable and predictive insights into the health of your devices and of the overall network.
-
Notify—Paragon Insights notifies you through the GUI and alarms when problems in individual devices or in the network are detected.
-
Act—Paragon Insights performs user-defined actions to help resolve and proactively prevent network problems.

Benefits of Paragon Insights
-
Customization—Provides a framework to define and customize health profiles, allowing truly actionable insights for the specific device or network being monitored.
-
Automation—Automates root cause analysis and log file analysis, streamlines diagnostic workflows, and provides self-healing and remediation capabilities.
-
Greater network visibility—Provides advanced multidimensional analytics across network elements, giving you a clearer understanding of network behavior to establish operational benchmarks, improve resource planning, and minimize service downtime.
-
Intuitive GUI—Offers an intuitive web-based GUI for policy management and easy data consumption.
-
Open integration—Lowers the barrier of entry for telemetry and analytics by providing open source data pipelines, notification capabilities, and third-party device support.
-
Multiple data collection methods—Includes support for JTI, OpenConfig, NETCONF, CLI, Syslog, NetFlow, and SNMP.
