LSPs Missing from the Network Information Table
Problem
One or more label-switched paths (LSPs) are missing from the Tunnel tab in the network information table.
Solution
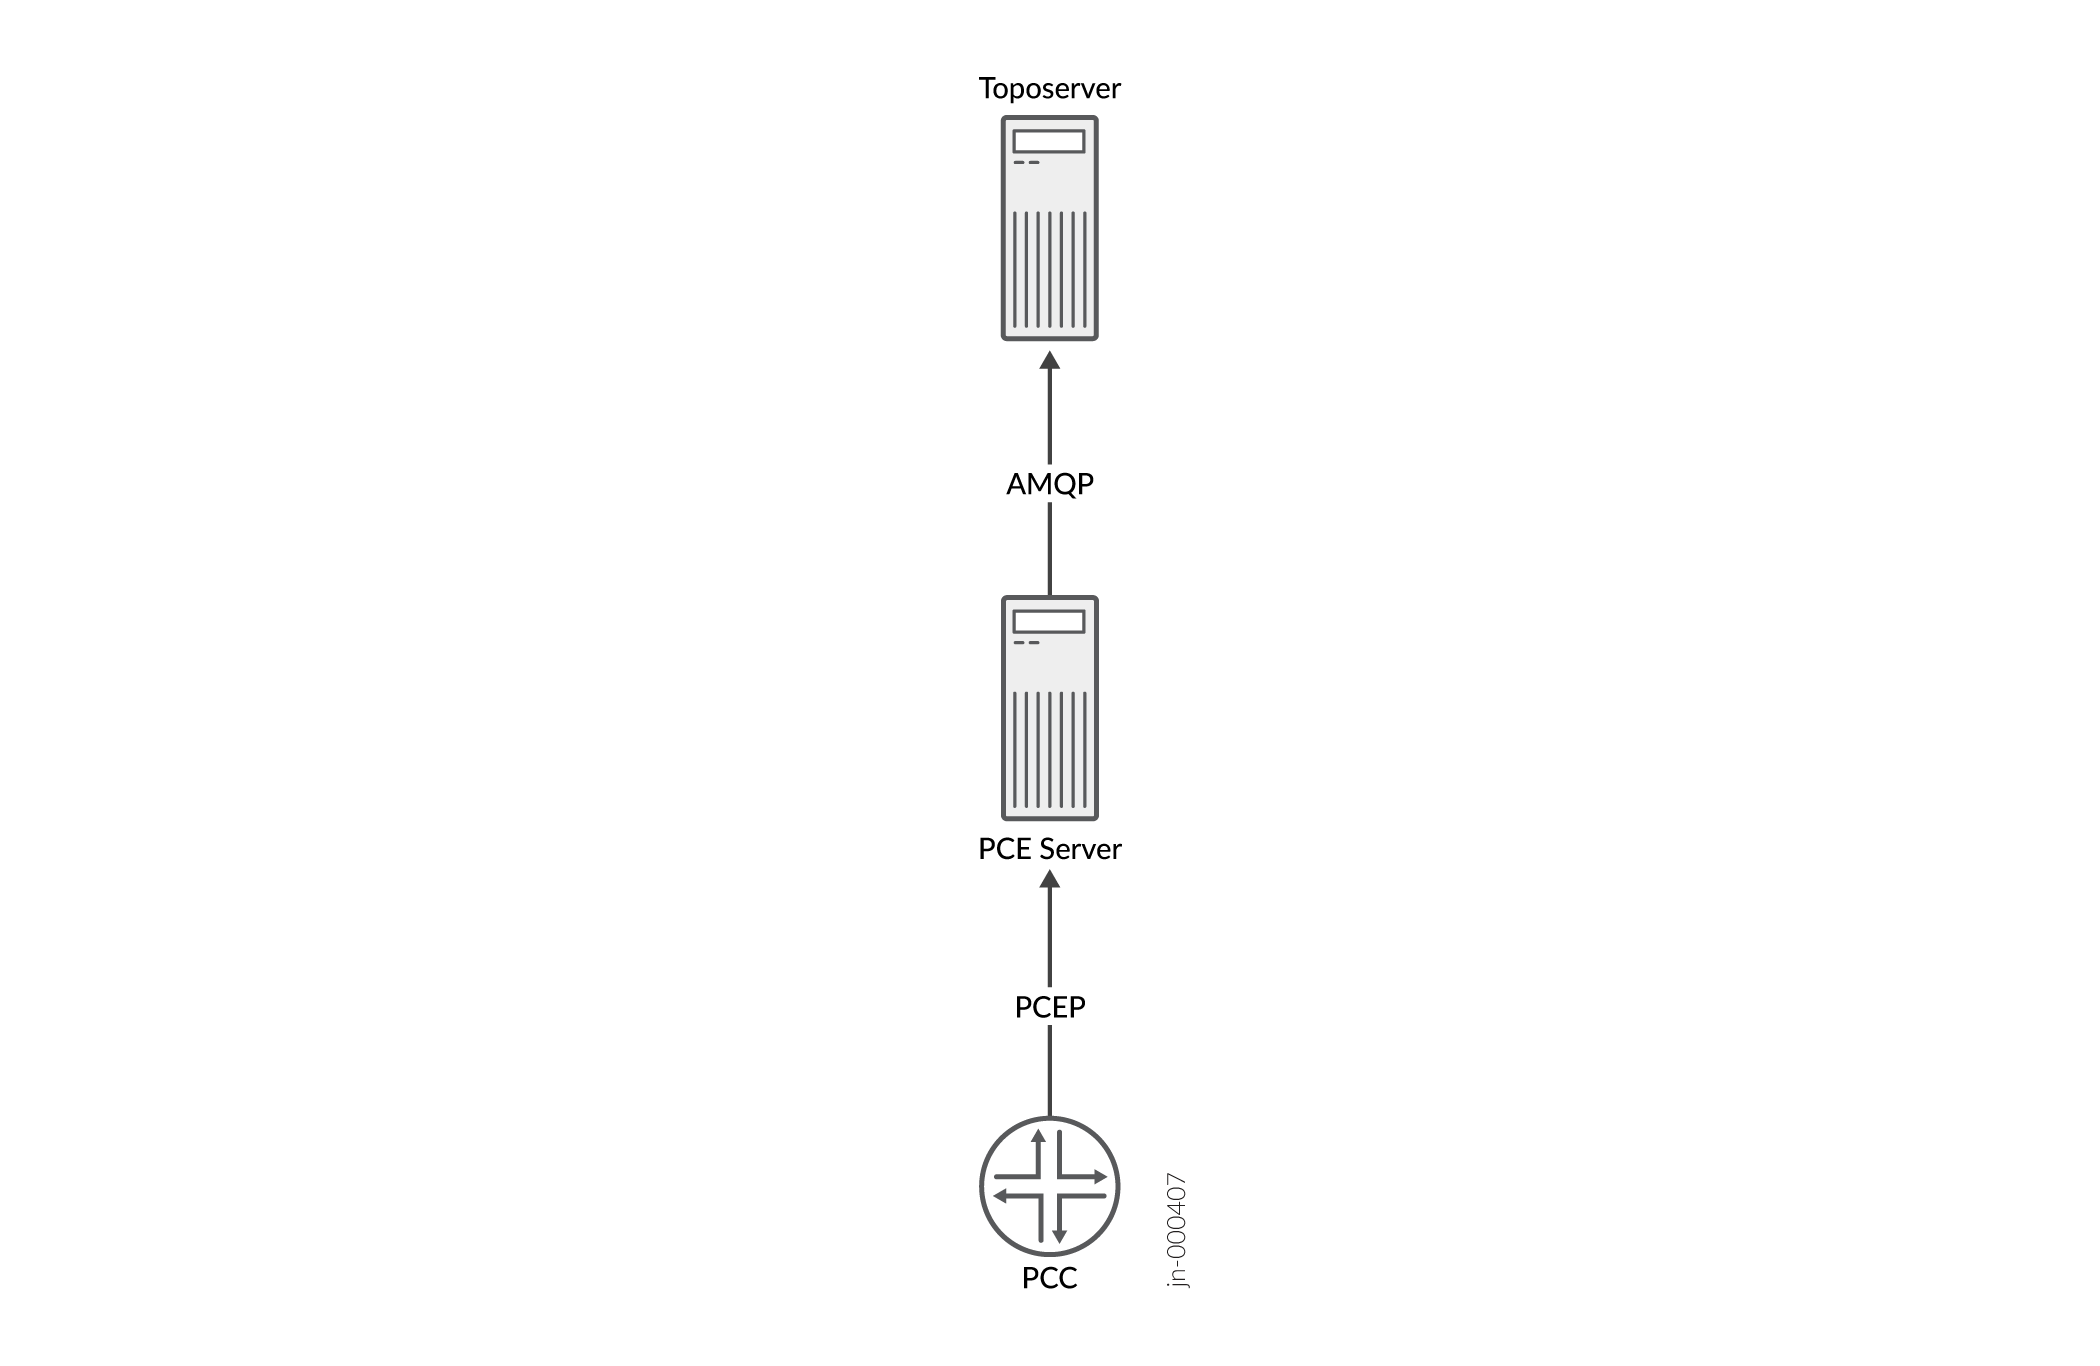
The topology map on the Topology page is populated from the data in the network information table. If one or more LSPs lack corresponding entries in the table, the paths cannot be highlighted in the topology map. To troubleshoot the problem, you must understand the flow of information from the Path Computation Client (PCC) to the Topology server (also called Toposerver), as illustrated in Figure 1. The LSPs are added to the network information table only if this flow of information is successful. The flow begins with the configuration at the PCC. The PCC sends an LSP Update message to the Path Computation Element (PCE) server through a PCEP session. The PCE server sends this message to the Toposerver through an Advanced Message Queuing Protocol (AMQP) connection.

To check these connections, do the following:
-
Using your server credentials, log in to the primary node of Paragon Automation.
-
From the primary node, use the following command to obtain the name of the pod in which the PCE server process runs:
kubectl -n northstar get pod | grep pce
-
Use the following command to log in to the PCE server pod:
kubectl -n northstar exec -it ns-pceserver-pod-name -c ns-pceserver -- bash
-
Use the following command to view the logs associated with the PCE server:
kubectl -n northstar logs -f ns-pceserver-pod-name -c syslog
In the following example log, the connection between the Toposerver and the PCE server is marked as Down:
Note:The logs that you view may differ from the logs in this document. The logs change based on the installed version of Paragon Automation.
Toposerver log:
Apr 22 16:21:35.016721 user-PCS TopoServer  Warning, did not receive the PCE beacon within 15 seconds, marking it as down. Last up: Fri Apr 22 16:21:05 2016
Apr 22 16:21:35.016901 user-PCS TopoServer  [->PCS] PCE Down: Warning, did not receive the PCE beacon within 15 seconds, marking it as down. Last up: Fri Apr 22 16:21:05 2016
Apr 22 16:21:50.030592 user-PCS TopoServer  Warning, did not receive the PCE beacon within 15 seconds, marking it as down. Last up: Fri Apr 22 16:21:05 2016
Apr 22 16:21:50.031268 user-PCS TopoServer  [->PCS] PCE Down: Warning, did not receive the PCE beacon within 15 seconds, marking it as down. Last up: Fri Apr 22 16:21:05 2016
-
Install the netstat utility in the
pcep_servercontainer by using the following command; ensure that your system has Internet access:Note:The netstat utility is not available by default.
Run the following commands before you install netstat utility:
kubectl -n northstar exec -it ns-pceserver-pod-name -c ns-pceserver -- bash
apt-get update
apt-get install net-tools
-
Use the following command to verify that the PCEP session between the PCC and the PCE server is established through port 4189:
netstat -na | grep 4189
Following is sample output:
tcp        0      0 0.0.0.0:4189                0.0.0.0:*                   LISTEN
tcp        0      0 172.25.152.42:4189          172.25.155.50:59143         ESTABLISHED
tcp        0      0 172.25.152.42:4189          172.25.155.48:65083         ESTABLISHED
-
Even if the session is established, it does not necessarily mean that any data was transferred. From the PCE server pod, use the following command to check whether the PCE server discovered any LSPs from the PCC through PCEP:
pcep_cli
show lsp all list
Following is sample output:
2016-04-22 17:09:39.696061(19661)[DEBUG]: pcc_lsp_table.begin:
2016-04-22 17:09:39.696101(19661)[DEBUG]: pcc-id:1033771436/172.25.158.61, state: 0

2016-04-22 17:09:39.696112(19661)[DEBUG]: START of LSP-NAME-TABLE
…
2016-04-22 17:09:39.705358(19661)[DEBUG]: Summary pcc_lsp_table:
2016-04-22 17:09:39.705366(19661)[DEBUG]:   Summary LSP name tabl:
2016-04-22 17:09:39.705375(19661)[DEBUG]:     client_id:1033771436/172.25.158.61, state:0,num LSPs:13
2016-04-22 17:09:39.705388(19661)[DEBUG]:     client_id:1100880300/172.25.158.65, state:0,num LSPs:6
2016-04-22 17:09:39.705399(19661)[DEBUG]:     client_id:1117657516/172.25.158.66, state:0,num LSPs:23
2016-04-22 17:09:39.705410(19661)[DEBUG]:     client_id:1134434732/172.25.158.67, state:0,num LSPs:4
2016-04-22 17:09:39.705420(19661)[DEBUG]:   Summary LSP id table:
2016-04-22 17:09:39.705429(19661)[DEBUG]:     client_id:1033771436/172.25.158.61, state:0, num LSPs:13
2016-04-22 17:09:39.705440(19661)[DEBUG]:     client_id:1100880300/172.25.158.65, state:0, num LSPs:6
2016-04-22 17:09:39.705451(19661)[DEBUG]:     client_id:1117657516/172.25.158.66, state:0, num LSPs:23
2016-04-22 17:09:39.705461(19661)[DEBUG]:     client_id:1134434732/172.25.158.67, state:0, num LSPs:4
In the far right column of the output, you can view the number of LSPs that the PCE server learned. If this number is 0, the PCE server did not receive any LSP information. In that case, check the configuration on the PCC. For information about how to check the configuration on the PCC, see your vendor's documentation for the PCC.
