Configure Routers to Advertise Link Statistics through BGP-LS
You can use Border Gateway Protocol-Link State (BGP-LS) to obtain information about the link delay and link delay variation (variation in the measured delay between consecutive readings) from a network. In the previous releases, the link delay information was obtained from real-time performance monitoring (RPM) probes configured on the routers.
The path computation element (PCE) in Paragon Pathfinder uses the measured link delays to compute the end-to-end LSP delay as a sum of all link delays in an LSP path. If a maximum delay is configured for the LSP and if the computed link delay violates the configured maximum delay, the PCE computes and reroutes the LSP through a path that has a link delay within the configured maximum delay.
You can configure Juniper Networks routers to send measured link delay through BGP-LS only if:
-
Junos OS 21.3 is running on the router.
-
IS-IS protocol is configured on a point-to-point link
To configure a Juniper Networks routers to send the measured delay and delay variation on a link through BGP-LS:
- Right-click a link label in the network topology (Network >
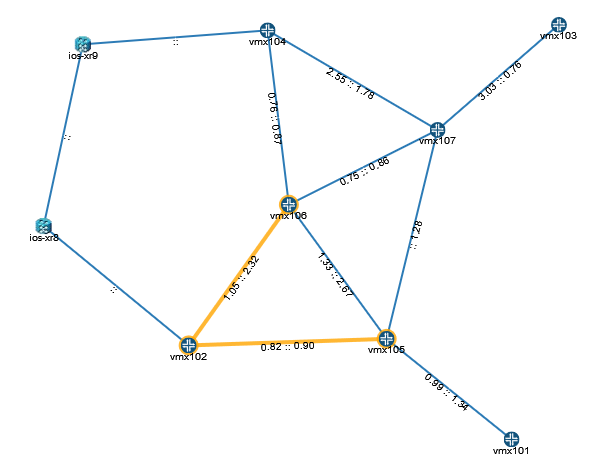
Topology) and select Measured Delay A::Z . The
measured delay is listed on the links as shown in Figure 1.Figure 1: Measured Link Delay Indicated on Links in the Network Topology

- The Measured Delay A and Measured Delay Z columns in the Links tab of the Network
Information table display the measured delay on respective ends of the link; see Figure 2.Figure 2: Measured Delay Displayed in the Network Information Table

