Juniper Data Center Assurance Datasheet
Download DatasheetProduct overview
Juniper Data Center Assurance, a suite of cloud‑hosted, AI‑native capabilities, is designed to address a full range of data center network operations challenges for private cloud operators, including cross‑domain visibility, application assurance, predictive and proactive maintenance, root cause analysis, trouble resolution, workflow acceleration, and more. Data Center Assurance works together with Apstra Data Center Director, industry‑leading multivendor intent‑based networking (IBN), to create a truly unique AIOps experience. They combine application visibility with broad‑spectrum network data, creating a comprehensive network operations solution.
Product description
Apstra Data Center Director is a multivendor, intent‑based networking (IBN) solution that automates and validates the design, deployment, and operation of data center networks from Day 0 through Day 2. Juniper® Data Center Assurance complements Data Center Director by adding cloud‑based, AI‑native applications that deliver probabilistic inferences, insights, and actionable intelligence based on rich data from Data Center Director.
Together, Data Center Assurance and Data Center Director provide a holistic solution to complex problems across various domains and network operations by integrating application visibility with existing network data.
Data Center Assurance consists of the following cloud services:
- Marvis® AI Assistant for Data Center is the digital network expert that supports your data center network operations team, providing proactive and prescriptive data center actions, simplifying operations tasks via the AI‑native Marvis conversational interface. By combining the power of an agentic AI framework with Data Center Director’s intent‑based networking, Marvis AI Assistant for Data Center enables data center network operations teams to save time and money and increase network uptime by accelerating problem resolution
- Marvis Minis for Data Center are agents that bring the benefits of proactive troubleshooting to data center network operators. The first data center Marvis Minis proactively assure data center core services for uninterrupted application availability
- Application Awareness shows which applications are hosted in your data center, along with details such as how they’re communicating and what resources they’re consuming. It provides topology maps to visualize the relationships between endpoints and applications, along with connections through the fabric and the resources used by those endpoints and the applications running on them. Application Awareness gives you complete visibility and understanding of how everything fits together
- Impact Analysis builds upon service awareness to reduce alert fatigue and eliminate guesswork from your network and application troubleshooting process. The Data Center Director graph database, now enriched with additional network monitoring and flow data, maps data center fabric conditions to application and service issues (and vice versa), allowing you to quickly understand how anomalies in the network or connections are impacting other parts of the business
- Service Level Expectations (SLEs) quantify user experience and network performance. SLEs, including System Health, Link Health, and Fabric Health, employ classifiers to pinpoint issues. A lower SLE score signals potential network performance concerns, and classifiers aid in root cause analysis. Administrators can review these metrics at various levels to proactively resolve problems.
Features and benefits
Marvis Actions
Marvis Actions drives operational simplicity and transforms IT from reactive troubleshooting to proactive remediation. It offers a “morning cup of coffee” view that delivers visibility into high‑impact network issues at an organizational level so that administrators know exactly what they need to prioritize and focus on.
Marvis AI Assistant for Data Center adds a data center component to the top‑level Marvis Actions view, allowing end‑to‑end visibility of anomalies across the entire enterprise network, from users in campus and branch networks to applications in the data center.
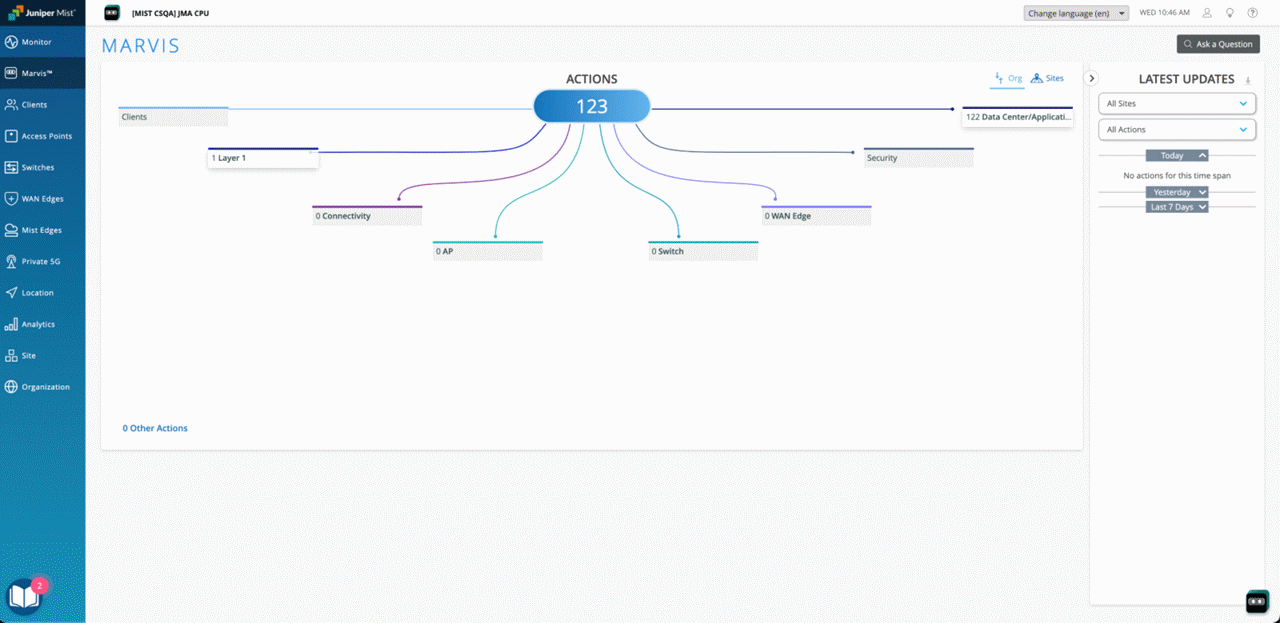
Figure 1: Marvis Actions dashboard, including data center
Marvis AI Assistant for Data Center leverages Data Center Director’s rich telemetry data to provide a high‑level view of data center network health on the Marvis Actions dashboard. Marvis highlights anomalies and recommended actions in data center switching devices, virtual infrastructure, physical and logical connectivity, and security. AI‑native insights lead to faster root cause identification and issue resolution. If more detailed information is required, a single click opens the relevant screen in the Data Center Director user interface where you can continue troubleshooting.
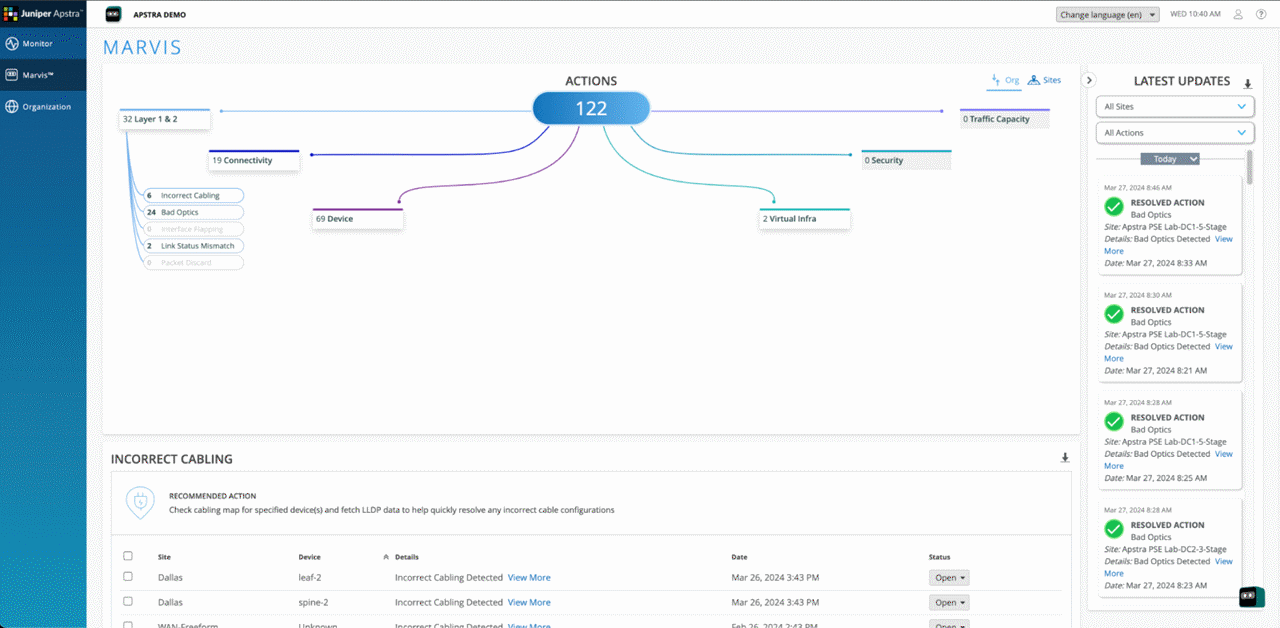
Figure 2: Marvis AI Assistant for Data Center actions dashboard
From the data center dashboard, you can select a category to see more detail about a specific metric, such as incorrect cabling or MTU issues. Table 1 shows the full list of data center action categories and metrics.
| Layer 1 & 2 | |
| Incorrect cabling | |
| Bad optics | |
| Interface flapping | |
| Link status mismatch | |
| Packet discard | |
| Connectivity | |
| Missing routes | |
| BGP mismatch | |
| LAG imbalance | |
| MLAG imbalance | |
| BGP flapping | |
| EVPN host flapping | |
| Type‑3 missing routes | |
| Type‑5 missing routes | |
| VXLAN flow lists mismatch | |
| Device | |
| Config deviation | |
| Deployment status mismatch | |
| Resource health issues | |
| Environment health issues | |
| Virtual infrastructure | |
| Configuration mismatch | |
| Missing VLANs | |
| MTU issues | |
| Non‑redundant hosts | |
| Security | |
| 802.1x issues | |
| Traffic capacity | |
| Spine faults | |
| Critical services alerts | |
| Hot/cold interface warning | |
Marvis AI Assistant for Data Center conversational assistant
Marvis' conversational assistant uses advanced natural language processing (NLP), generative AI (GenAI), and a powerful agentic AI framework that works with Data Center Director to understand user intent and goals and contextualize natural language inquiries to provide specific answers, whether you’re troubleshooting operations or searching for data center documentation.
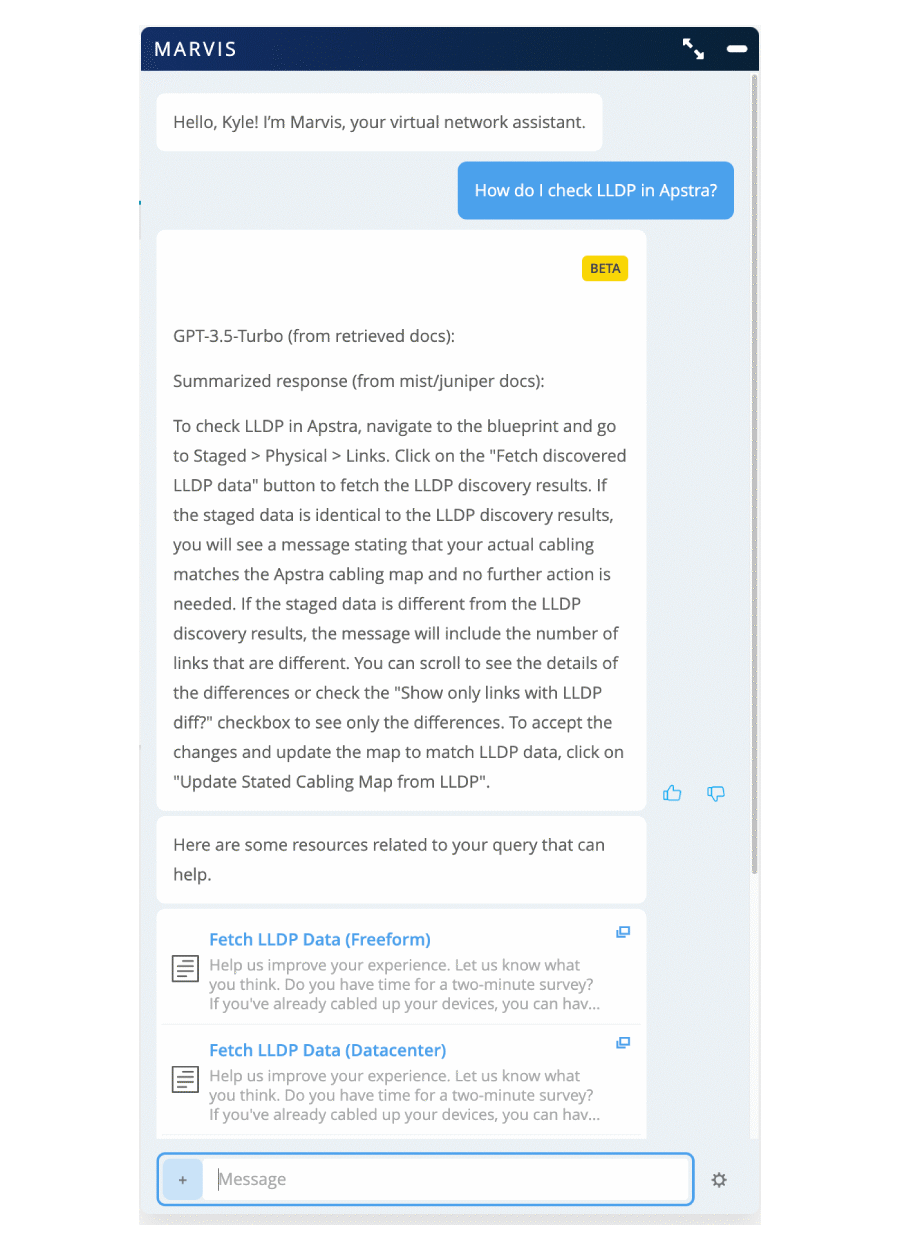
Figure 3: Marvis AI Assistant for Data Center conversational interface, illustrating a knowledge base search
Marvis Minis for Data Center
Marvis Minis for Data Center are agents designed to proactively assure data center core services for uninterrupted application availability. This capability addresses a set of common challenges for data center network operators, when servers and applications unexpectedly lose access to critical network services such as a domain name server (DNS) or a network storage device, resulting in poor application performance or even application downtime. Marvis Minis proactively test critical service access from various devices and locations in the network, identifying issues before they impact applications and end users. These Minis can be activated by network operators for specific situations, such as post-maintenance network health validation, and can also run autonomously with configurable test intervals to catch problems that may arise due to network changes or failures.
Application Awareness
Modern business applications are typically composed of collections of loosely coupled microservices where each service can be developed, deployed, and scaled independently. Understanding exactly how each application/service maps across the fabric and how the services are communicating can be a tedious task. Application Awareness, in conjunction with Data Center Director, provides a visual representation of application and service data, simplifies the tasks of implementing and managing services, and puts the information you need right at your fingertips.
Combining and enriching existing network monitoring protocols, such as sFlow, NetFlow, IPFIX, and IFA with Data Center Director’s rich graph data knowledge gives you a comprehensive view of the network. You can directly query the relationships between network and service data and gain insights that would be tough to find or infer from traditional databases or from jumping between tables. Application Awareness gives you a deeper understanding of the business‑critical systems with logical and physical topology awareness.
Application Awareness adds data to the Data Center Director network knowledge graph to provide:
- Visibility where services attach and access the network
- Visual understanding of “service to resource” mapping
- Knowledge of how services communicate
- Resource usage consumed by each service
The information allows you to understand exactly which services would be impacted by a port or link going down or experiencing performance degradation. This is critical in planning to ensure appropriate service performance and resiliency. Combined with the Impact Analysis feature, it also helps quickly determine the root cause of service issues, eliminating noise and reducing mean time to resolution.
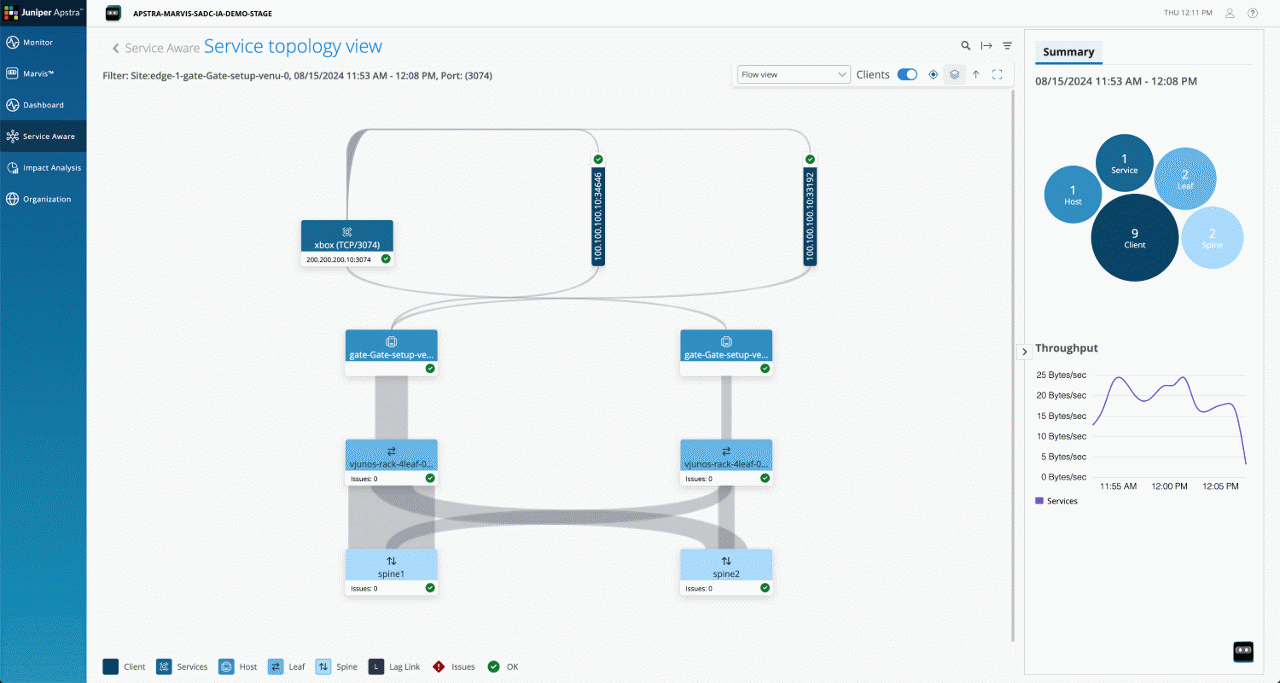
Figure 4: Application Awareness interface
Impact analysis
When problems occur in the data center fabric, it often results in a flood of alerts. Sorting through them and running additional queries manually to understand impact, prioritize, troubleshoot, and pinpoint the problem is time consuming at the worst possible time: when your services are down and your business productivity is in jeopardy. With Impact Analysis, you no longer have to worry about this. It queries the graph database, monitors flow data, and maps network conditions to application/service issues across relationships, allowing you to quickly understand how anomalies are impacting other parts of the business.
Impact Analysis takes advantage of AI and ML models to revolutionize the troubleshooting experience with:
- Reduced alert fatigue: By mapping conditions and impacts, Impact Analysis coalesces information and helps you distinguish which anomalies are related to the problem and which are side effects or unrelated. This allows you to focus on the critical issues without being overwhelmed by irrelevant alerts
- Clear picture of issues and impacts: Impact Analysis provides a comprehensive view of the problems affecting your applications. You'll have a better understanding of the issues and their impacts so you can prioritize and resolve them more efficiently
- ML for anomaly analysis: Using ML algorithms, Impact Analysis analyzes data from the graph database, raw telemetry, and network sources to map conditions and their impacts. This process further minimizes speculation in the troubleshooting process
- Compare states between different times: Impact Analysis allows you to compare the state of your resources at different times. This feature helps you identify trends, patterns, and potential bottlenecks that might be affecting your applications' performance
- Quicker recovery: With a clearer understanding of the issues and their impacts, you can quickly address problems and get your applications up and running in no time
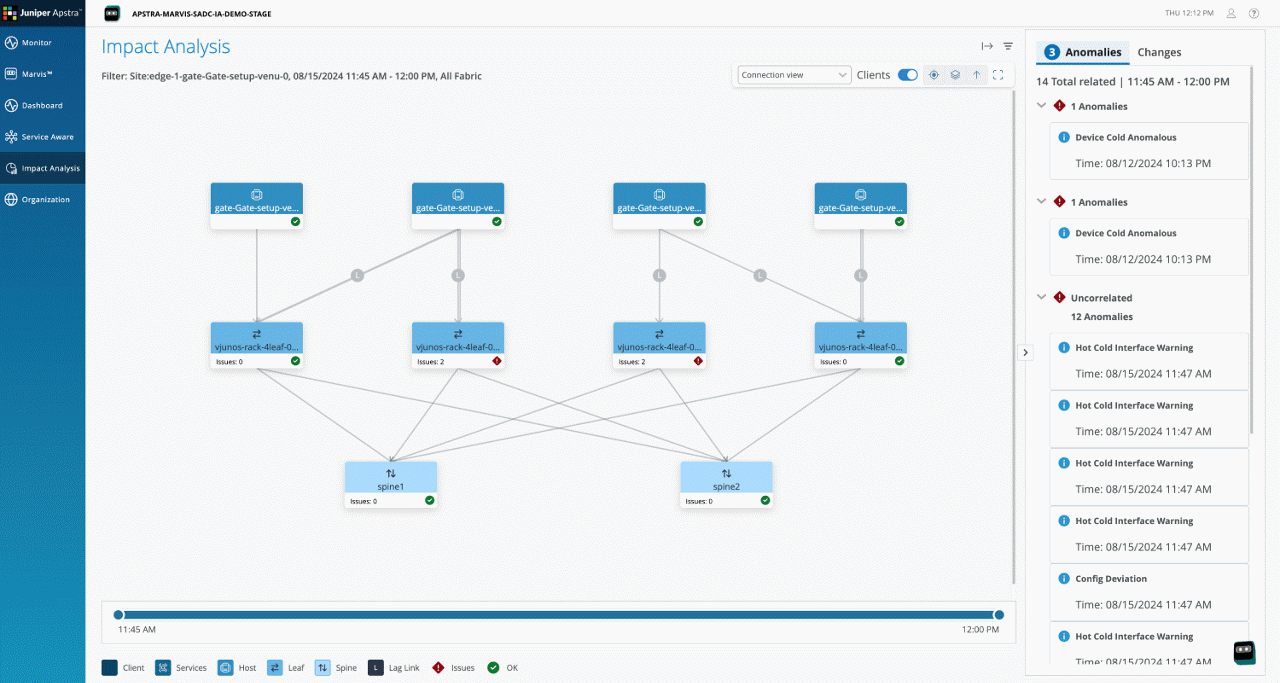
Figure 5: Impact Analysis interface
Service Level Expectations (SLEs)
Data Center Assurance SLEs offers robust capabilities for network administrators to ensure optimal performance and user experience. These critical mechanisms continuously monitor network performance, ensuring that service benchmarks are consistently met.
Key SLEs and their classifiers:
- System Health SLE: Focuses on the well-being of network devices and their configurations such as device traffic, as well as configuration deviations, environmental factors, and system resources
- Link Health SLE: Concentrates on the performance and stability of network links, such as down interfaces, bad optics, and hot/cold interfaces
- Fabric Health SLE: Provides an overarching view of the entire network fabric's health, aggregating insights from various components to ensure seamless end-to-end connectivity and performance
Administrators can analyze SLE scores, success rates, values, and historical timelines. This rich data helps you identify performance trends, predict potential issues, and make informed decisions regarding network adjustments or capacity planning. This enhances network reliability and optimizes user experience, as the system validates and maintains network health against defined service levels. This proactive monitoring and validation capability also improves operational efficiency by automating health checks, reducing manual troubleshooting, and lowering operational costs associated with network maintenance and issue resolution. See full overview here.
Dashboards
Data Center Assurance includes support for user‑defined dashboards that provide insights into metrics of interest, including inventory and resource usage. Operators who have multiple data centers managed by Data Center Director (for example, across different geographies or organizations) can see a global view of all networks or filter the view to specific sites.
Users can select from among a range of dashboard widgets to display:
- Top talkers
- Cluster health and versions
- Top devices by port count
- Top anomalies
- Inventory: devices and virtual networks
- Port activity
- Summary overview: total numbers of sites, devices, services, and anomalies
- Data Center Director geographic locations
- Data Center Director versions
- Site summary details
- Site comparisons
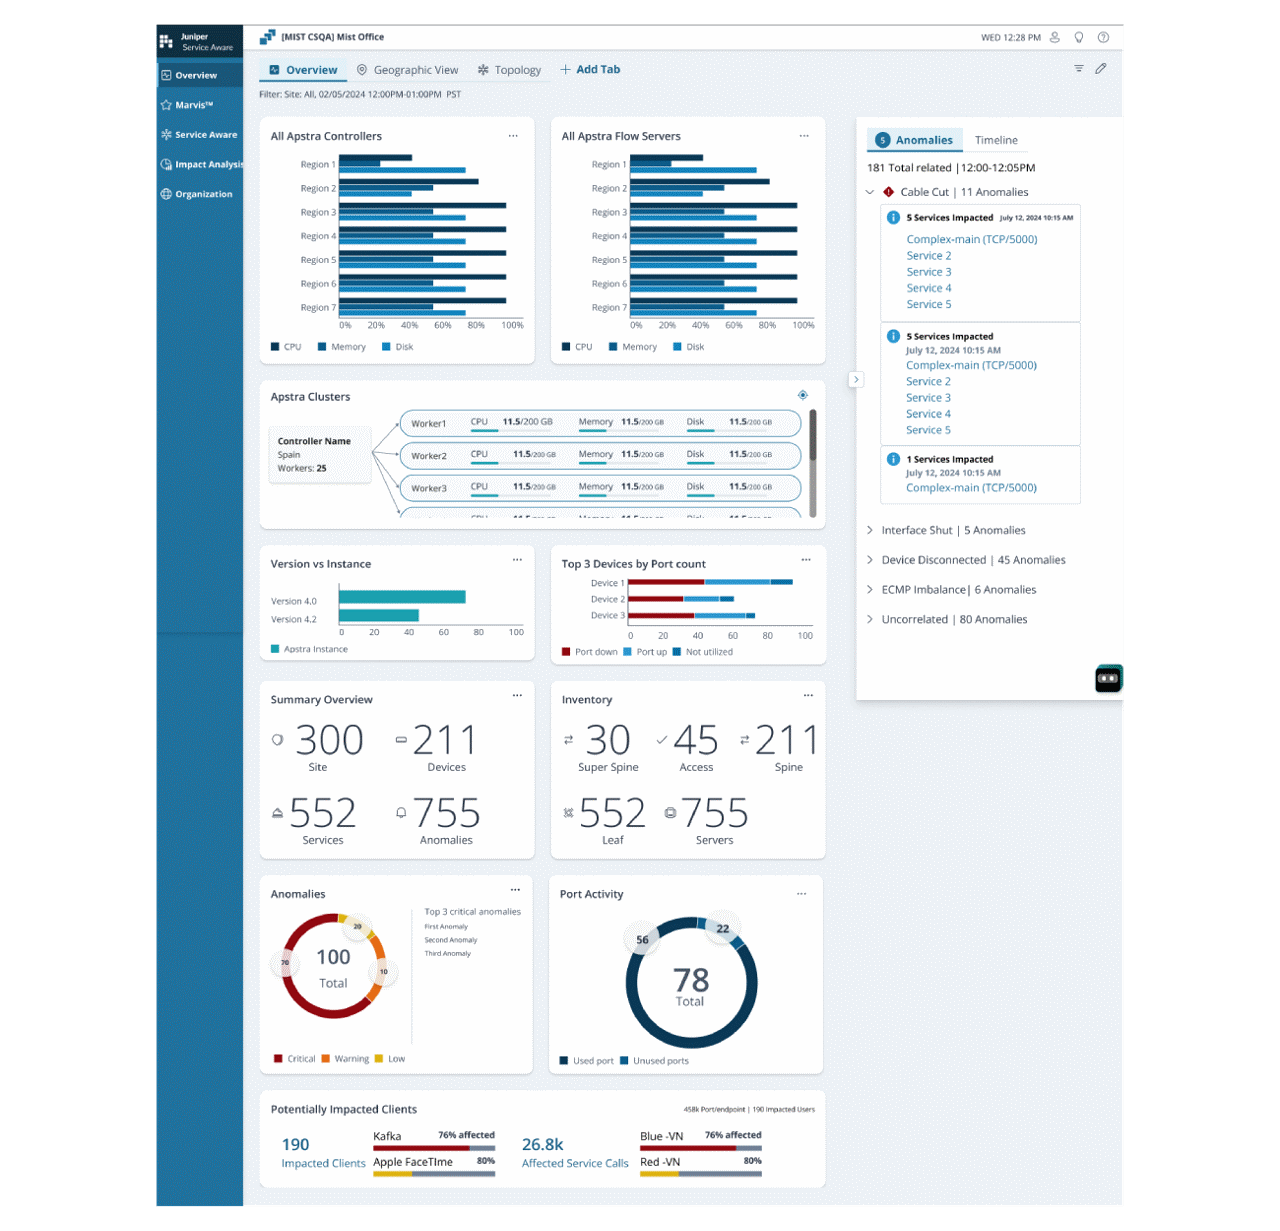
Figure 6: Dashboard interface
Multivendor compatibility
Since Data Center Director is inherently multivendor, working with both Juniper and many third‑party switching devices, Data Center Assurance inherit those multivendor properties, enabling the same visibility of services, data center network health, anomaly detection, impact analysis, and recommended actions, regardless of which switching vendors are deployed.
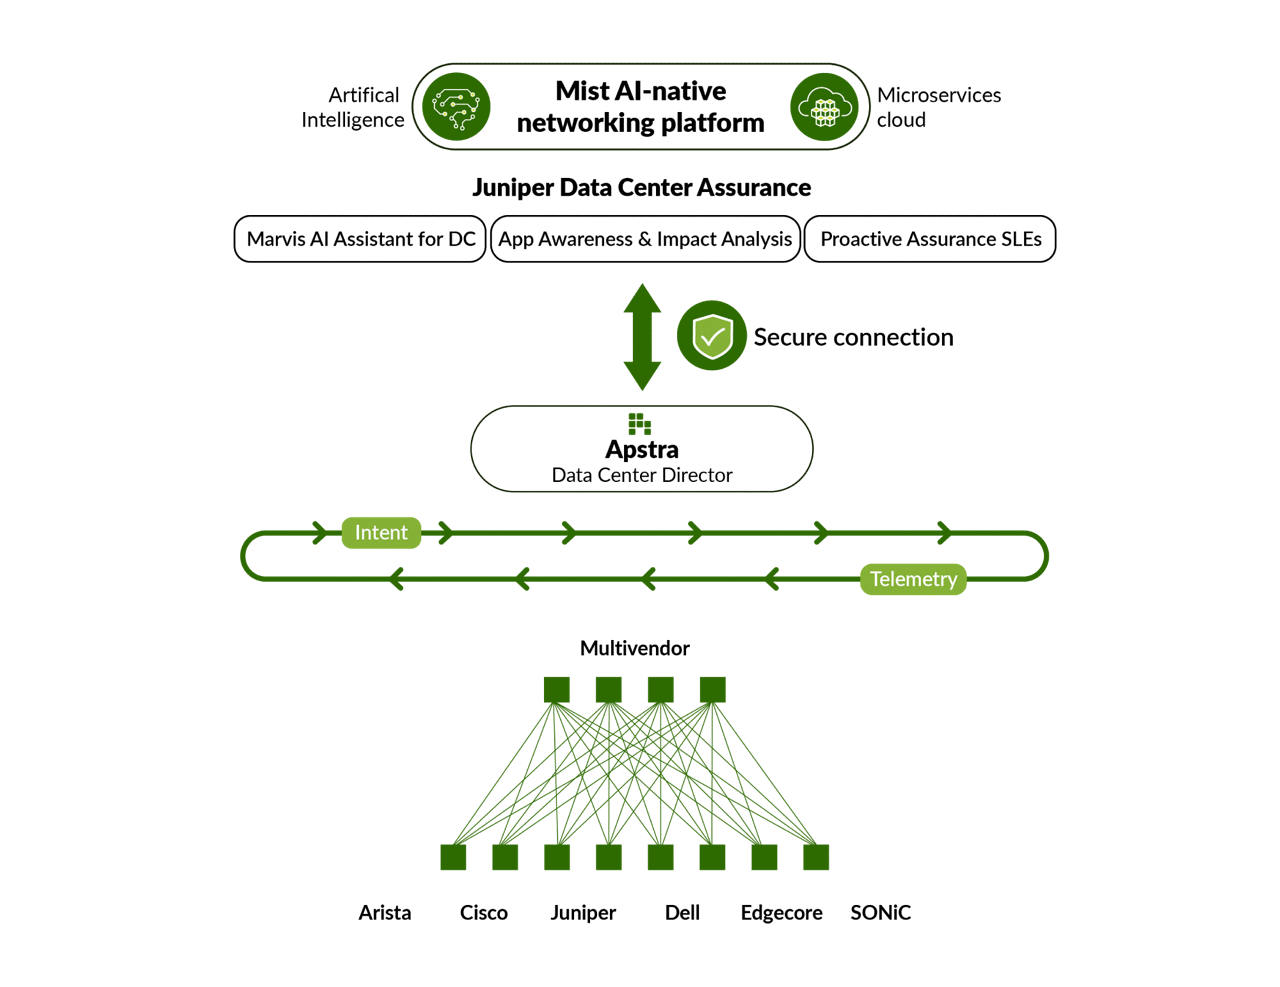
Figure 7: Data Center Assurance – Data Center Director integration
Integration with Data Center Director
Data Center Assurance is cloud‑based while Data Center Director is premises‑based. Connectivity between the two applications is enabled over a secure WebSocket connection that supports REST API requests, responses, and the streaming of telemetry data and alerts.
Ordering information
Data Center Assurance is included with Data Center Director, depending on the licensing tier.
| Data Center Assurance | License Tier |
| Marvis AI Assistant for Data Center | Standard and above |
| All other Data Center Assurance applications | Premium |
About Juniper Networks
HPE Juniper Networking is leading the convergence of AI and networking. Mist™, Juniper’s AI-native networking platform, is purpose-built to run AI workloads and simplify IT operations, assuring exceptional and secure user and application experiences—from the edge to the data center to the cloud. Additional information can be found at www.juniper.net, X, LinkedIn, and Facebook.
1000796 - 003 - EN AUGUST 2025


