- play_arrow Introduction
- play_arrow Feature Guide
- Using Contrail Insights APIs
- Aggregate of Network Device Entities
- Aggregate Discovery and Alarms with OpenStack Heat Services
- Alarms
- Composite Alarms
- Application Event Ingestion
- Capacity Planning
- Chargeback
- Charts
- Contrail Insights Platform Health
- Health Monitor
- Heat Map
- Contrail Insights with Kafka
- Metrics Collected by Contrail Insights
- Notifications
- OpenStack Nova Scheduler Service
- Extensibility Using Plug-Ins
- Reports
- Endpoint Monitoring with Service Groups
- Service Monitoring from the UI
- Contrail Insights VNF Monitoring
- Configure Network Devices from the UI
- Contrail Insights Auto Discovery of Network Devices from Contrail Networking
- Contrail Insights JTI (UDP) Monitoring
- Contrail Insights JTI (gRPC) Monitoring
- Contrail Insights SNMP Monitoring
- SNMP Traps in Contrail Insights
- Contrail Insights NETCONF CLI Monitoring
- Contrail Insights Network Device Monitoring Common Issues
- play_arrow Installing Contrail Insights
- Contrail Insights General Requirements
- Contrail Insights Agent Requirements
- Platform Dependencies
- Contrail Insights Installation for Kubernetes
- Contrail Insights Installation for NorthStar
- Contrail Insights Installation and Configuration for OpenStack
- Contrail Insights Installation for Ubuntu Focal
- Contrail Insights Installation for Containerized OpenStack (OpenStack Kolla, Red Hat OpenStack Platform 13)
- Contrail Insights Installation for OpenStack in HA
- Contrail Insights Installation for OpenStack Helm
- Contrail Insights Installation for Standalone
- Contrail Insights Settings
- play_arrow Ansible Configuration
- Bare Host
- Contrail Insights MultiCluster Mode
- Contrail Insights MultiCluster Proxy
- Contrail Insights User-Defined Plug-Ins
- Contrail Insights Port List
- Contrail Insights Role-Based Access
- Configure Network Device from JSON File
- Contrail Insights Plug-Ins
- Contrail Insights User-Defined Plug-Ins
- Instance Scope Plug-Ins
- Contrail Insights Object Plug-In
- Custom SNMP Plug-Ins
- Custom Sensors for JTI, gRPC, and NETCONF
- Remote Hosts
- Monitor NFX250 with Contrail Insights Agent
- Contrail Insights SDKs
- Contrail Insights with SSL (HTTPS) Enabled
- Service Monitoring Ansible Variables
- OpenStack Services Monitoring Using Service Group Profiles
- Ansible Configuration Variables
- play_arrow Downloads
AppFormix Overview
AppFormix enables operators to control and visualize how infrastructure resources are utilized by workloads, and plan adequate capacity to ensure application performance. Using AppFormix, operators of software-defined data centers have a toolset for visibility into operational performance and infrastructure resources.
Figure 1 shows the product modules for the AppFormix optimization and management software platform.
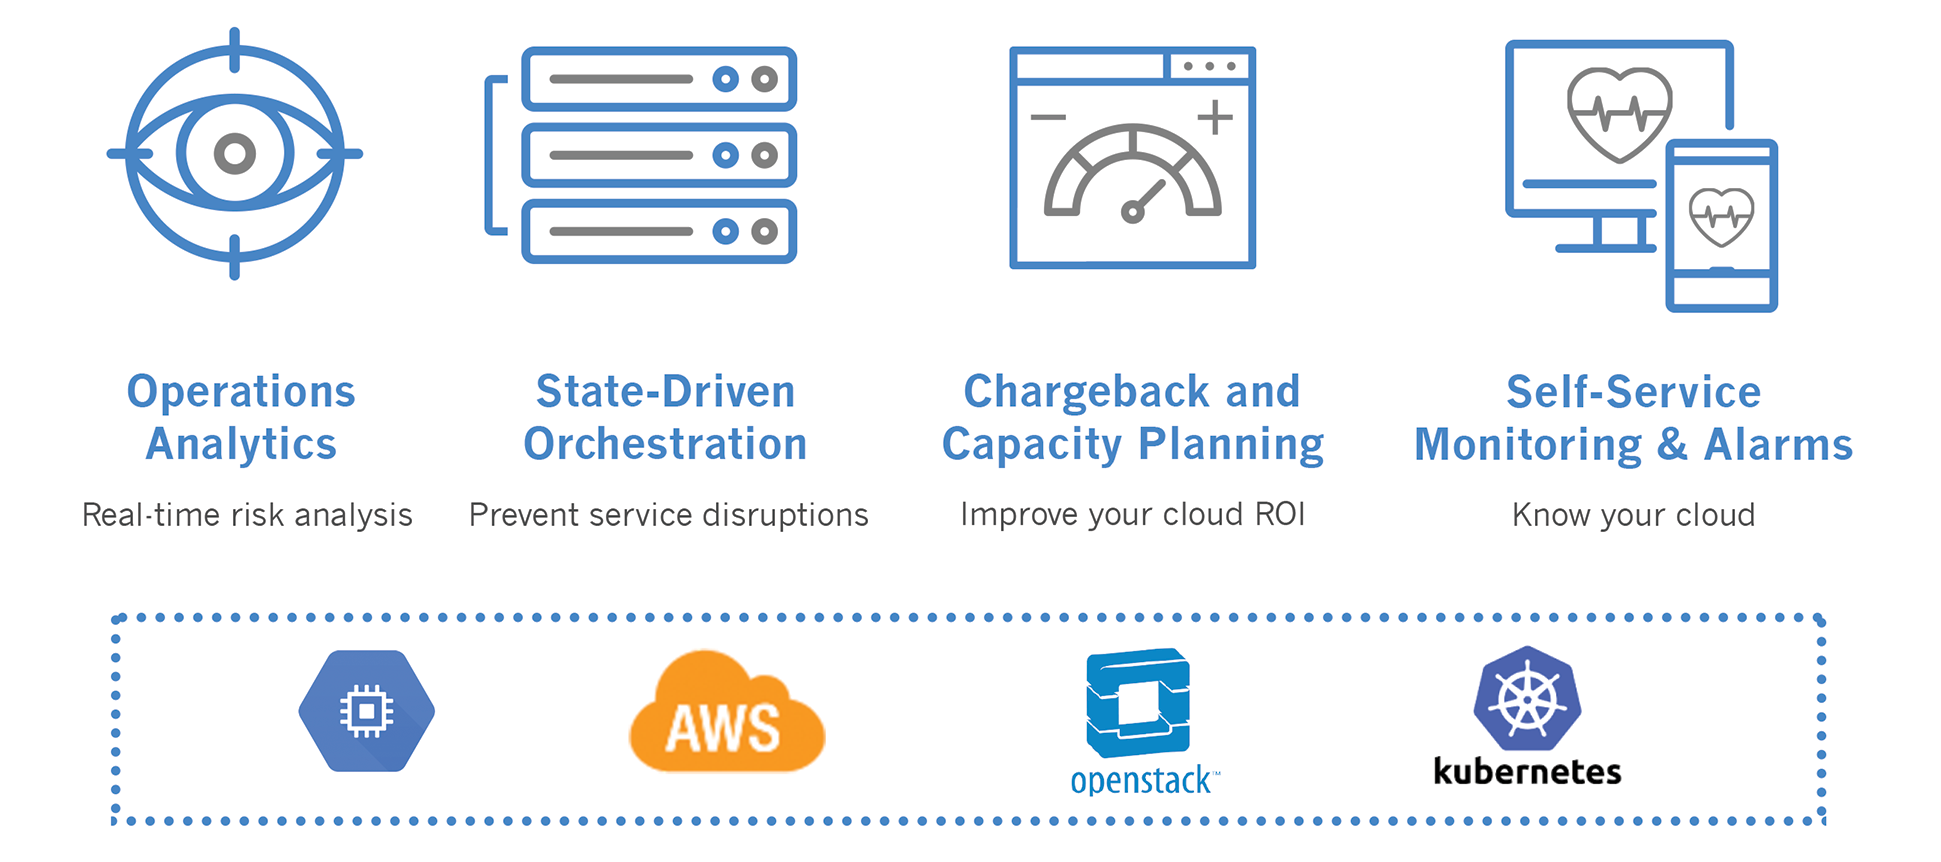
Juniper Networks AppFormix® is a cloud service optimization tool that provides advanced monitoring, scheduling, and performance management for software-defined infrastructure, where containers and virtual machines (VMs) can have life cycles much shorter than in traditional development environments.
The AppFormix software leverages big-data analytics and machine learning in a distributed architecture that puts the power of self-driving infrastructure at the core of almost any cloud. AppFormix redefines the state-of-the-art in telemetry and management across software-defined infrastructure and application software layers. In addition, real-time and historic monitoring, performance visibility and dynamic optimization features improve cloud orchestration, security, accounting, and planning. The following video provides an overview of the AppFormix infrastructure dashboard.
Video 1: AppFormix Dashboard
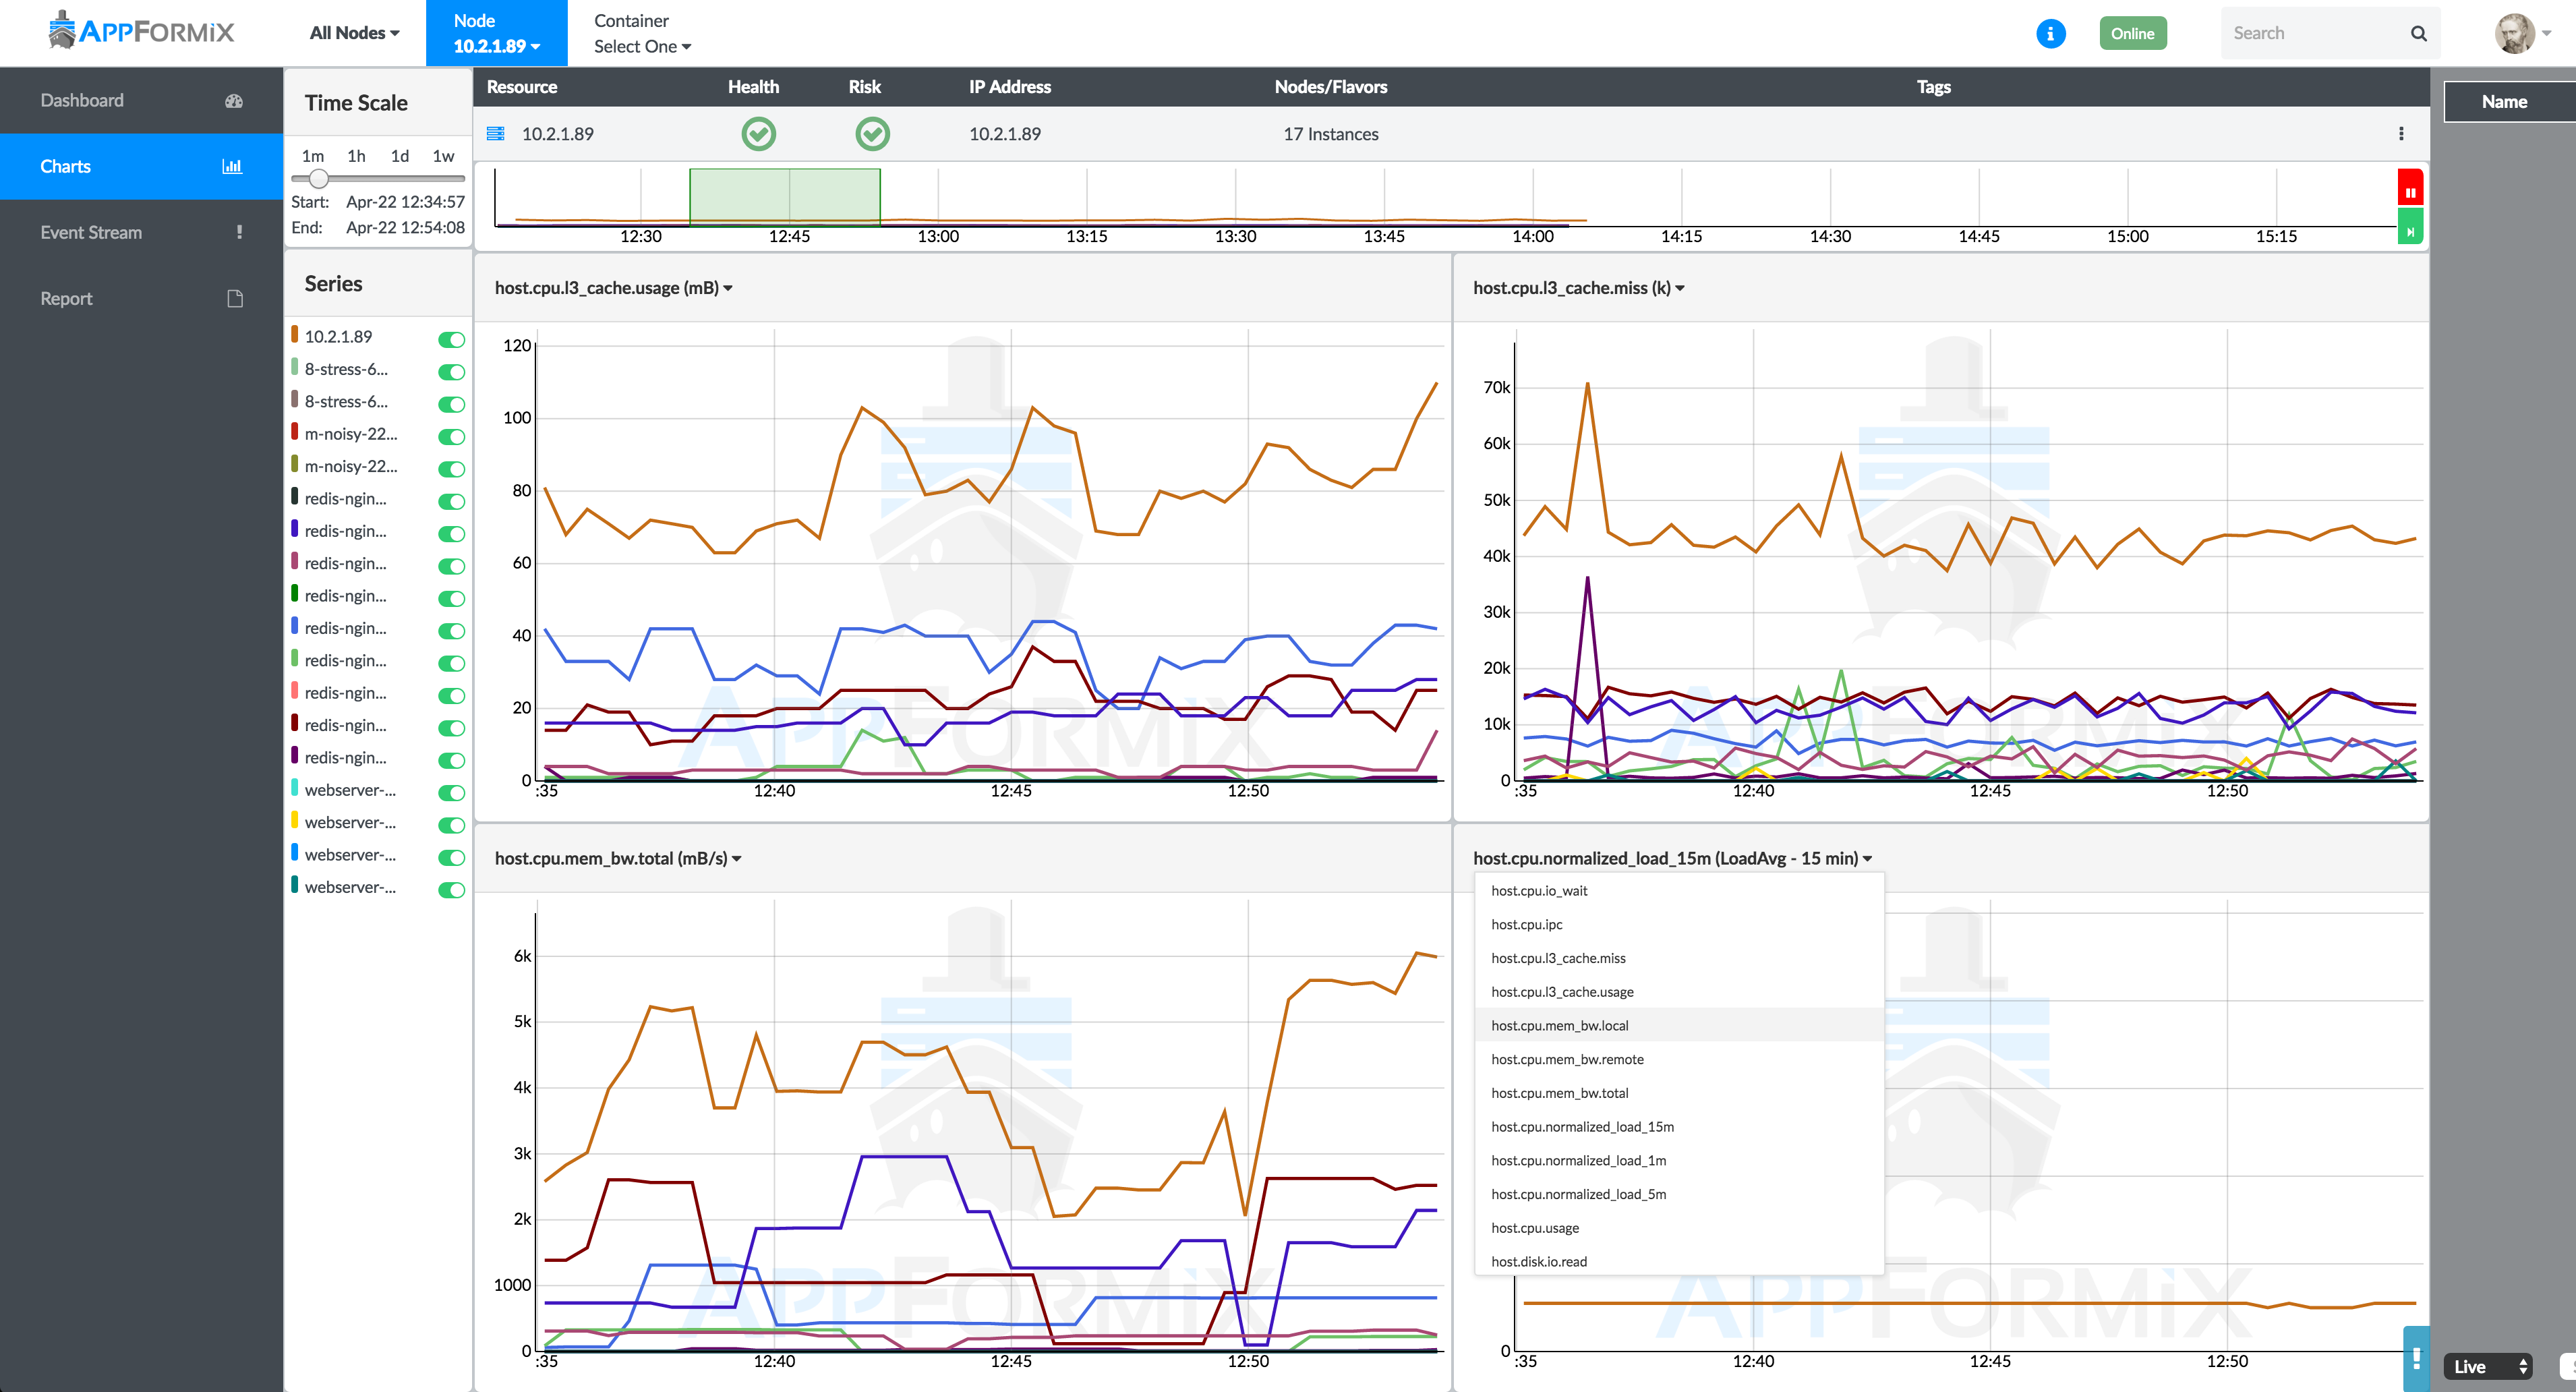
AppFormix operates in hybrid, private, or public enterprise cloud environments built on platforms such as OpenStack, VMware, Azure, and Amazon Web Services (AWS). AppFormix accommodates both containers and virtual machines to support multitenant, dynamic, and constantly evolving enterprise clouds. Figure 2 shows real-time CPU utilization in chart format for a specified host.
AppFormix analyzes metrics in real-time across all aspects of shared infrastructure—compute, storage, and networking—and associates resource consumption to containers and virtual machines. Figure 3 shows a report that charts the project CPU and memory utilization percentage for specified dates.
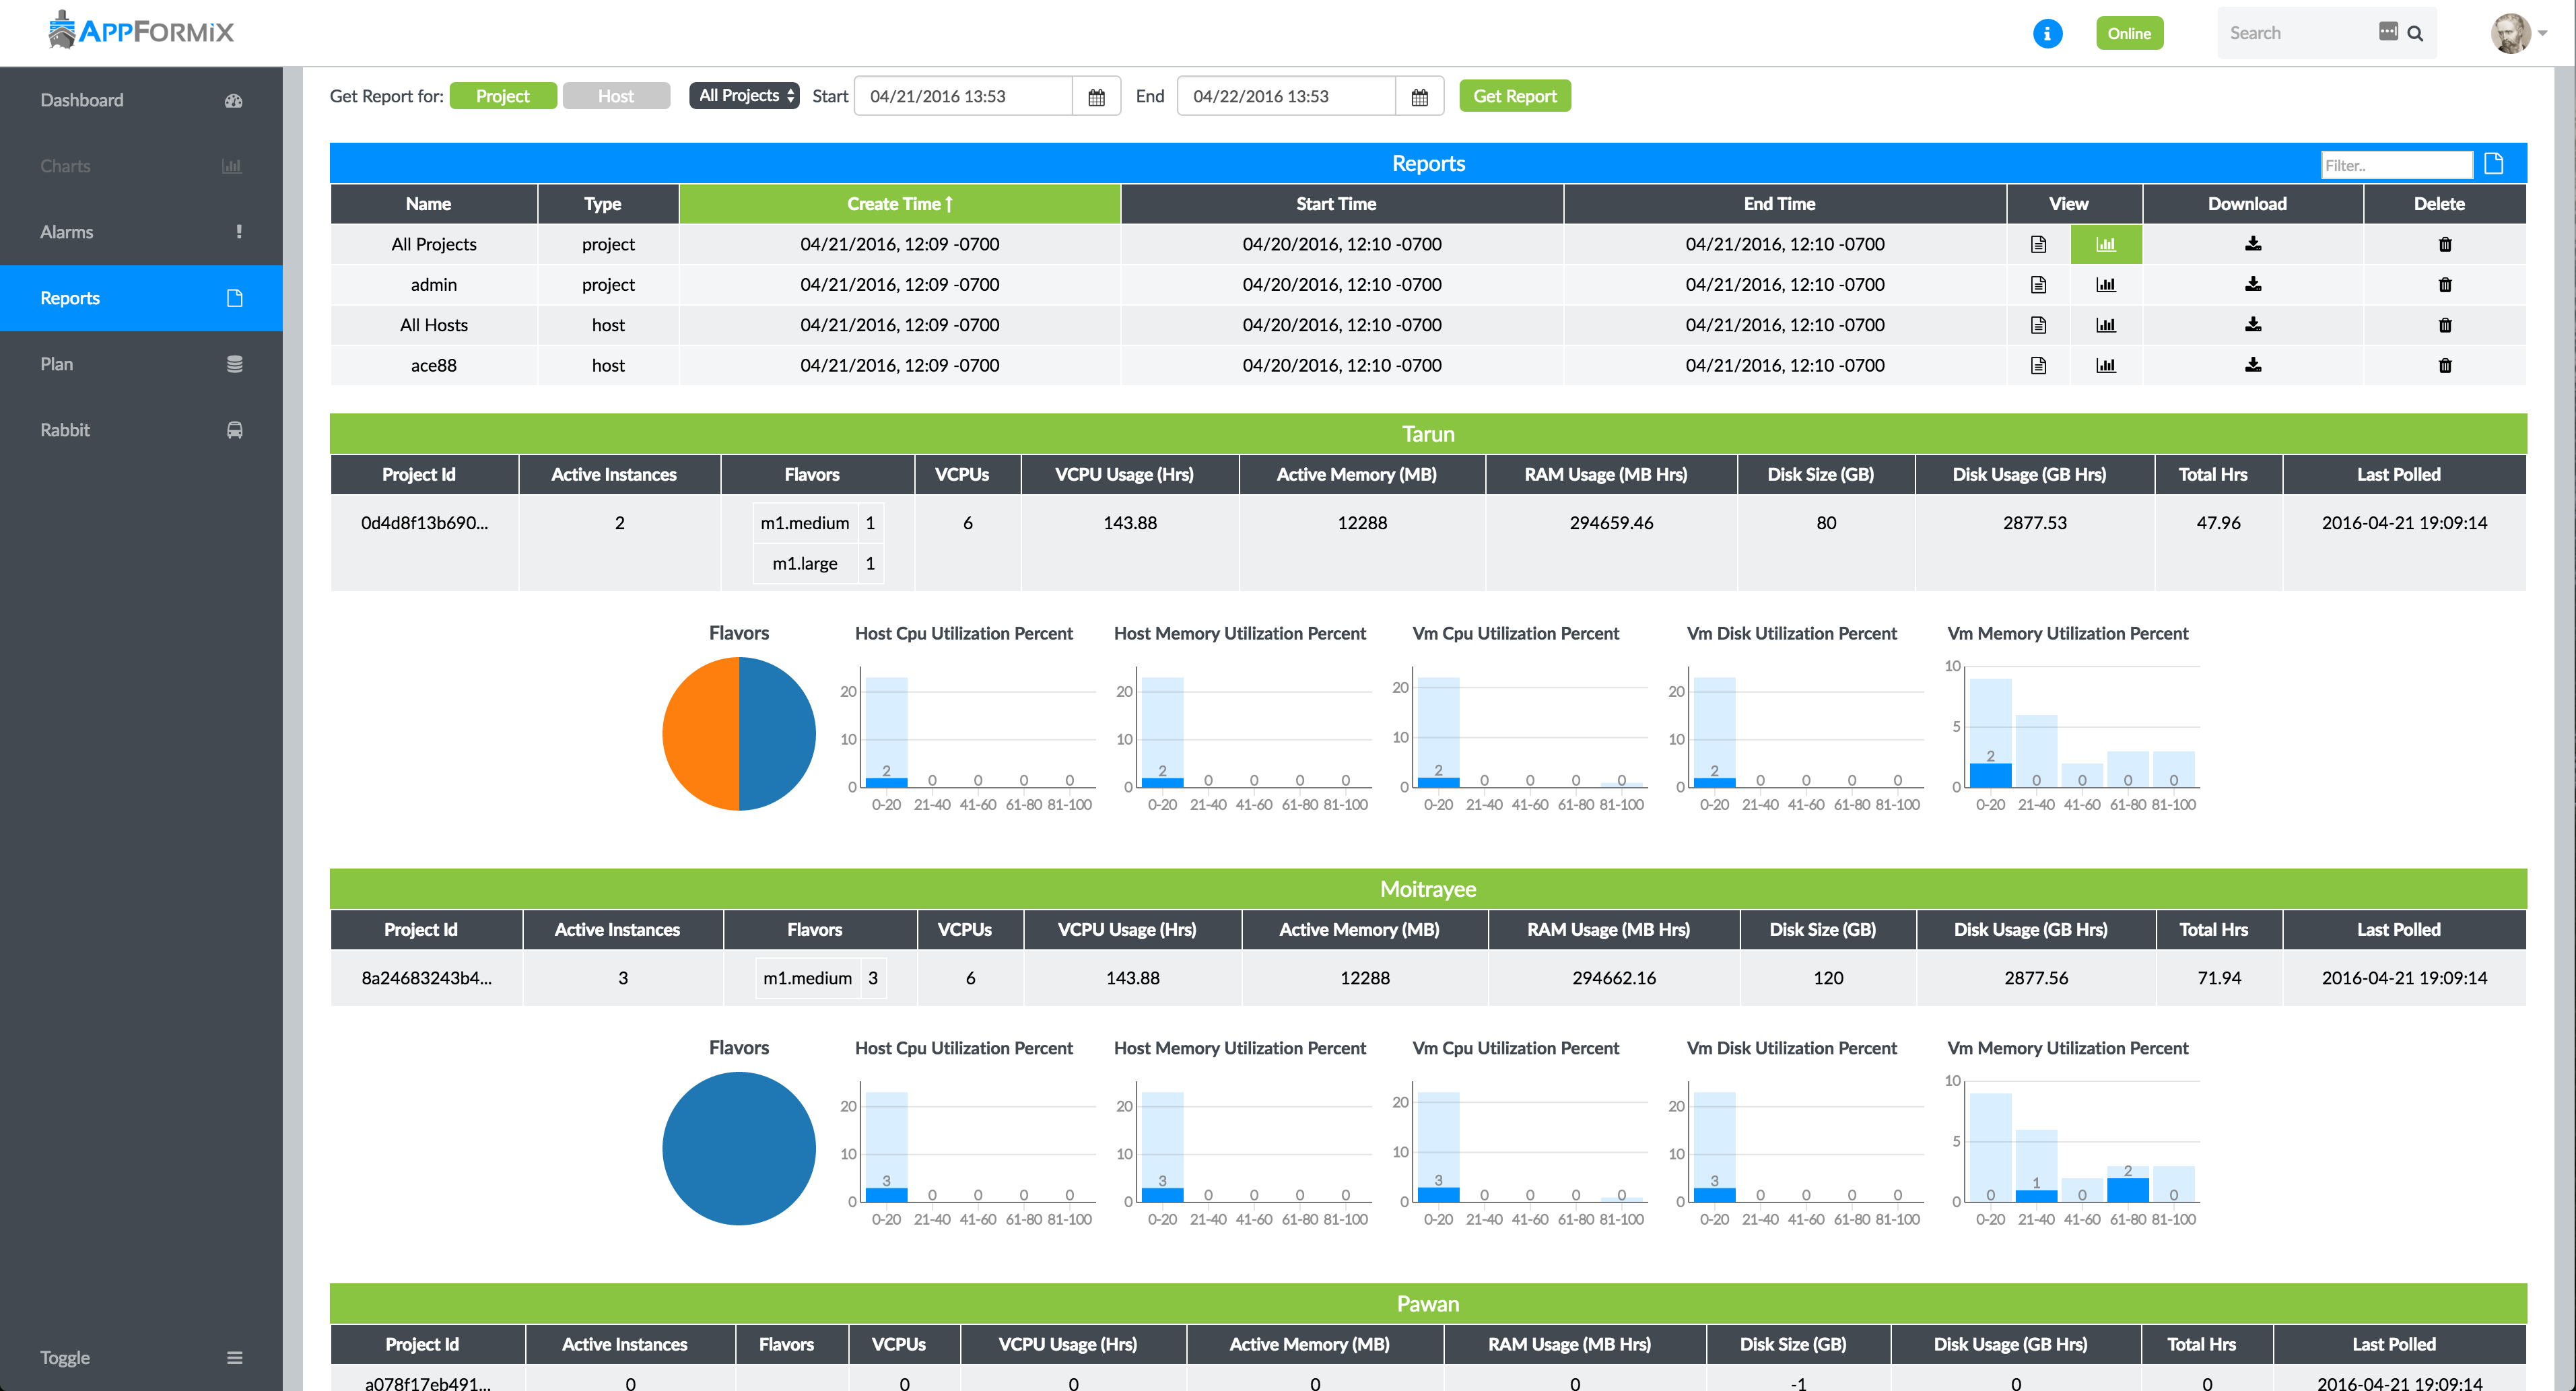
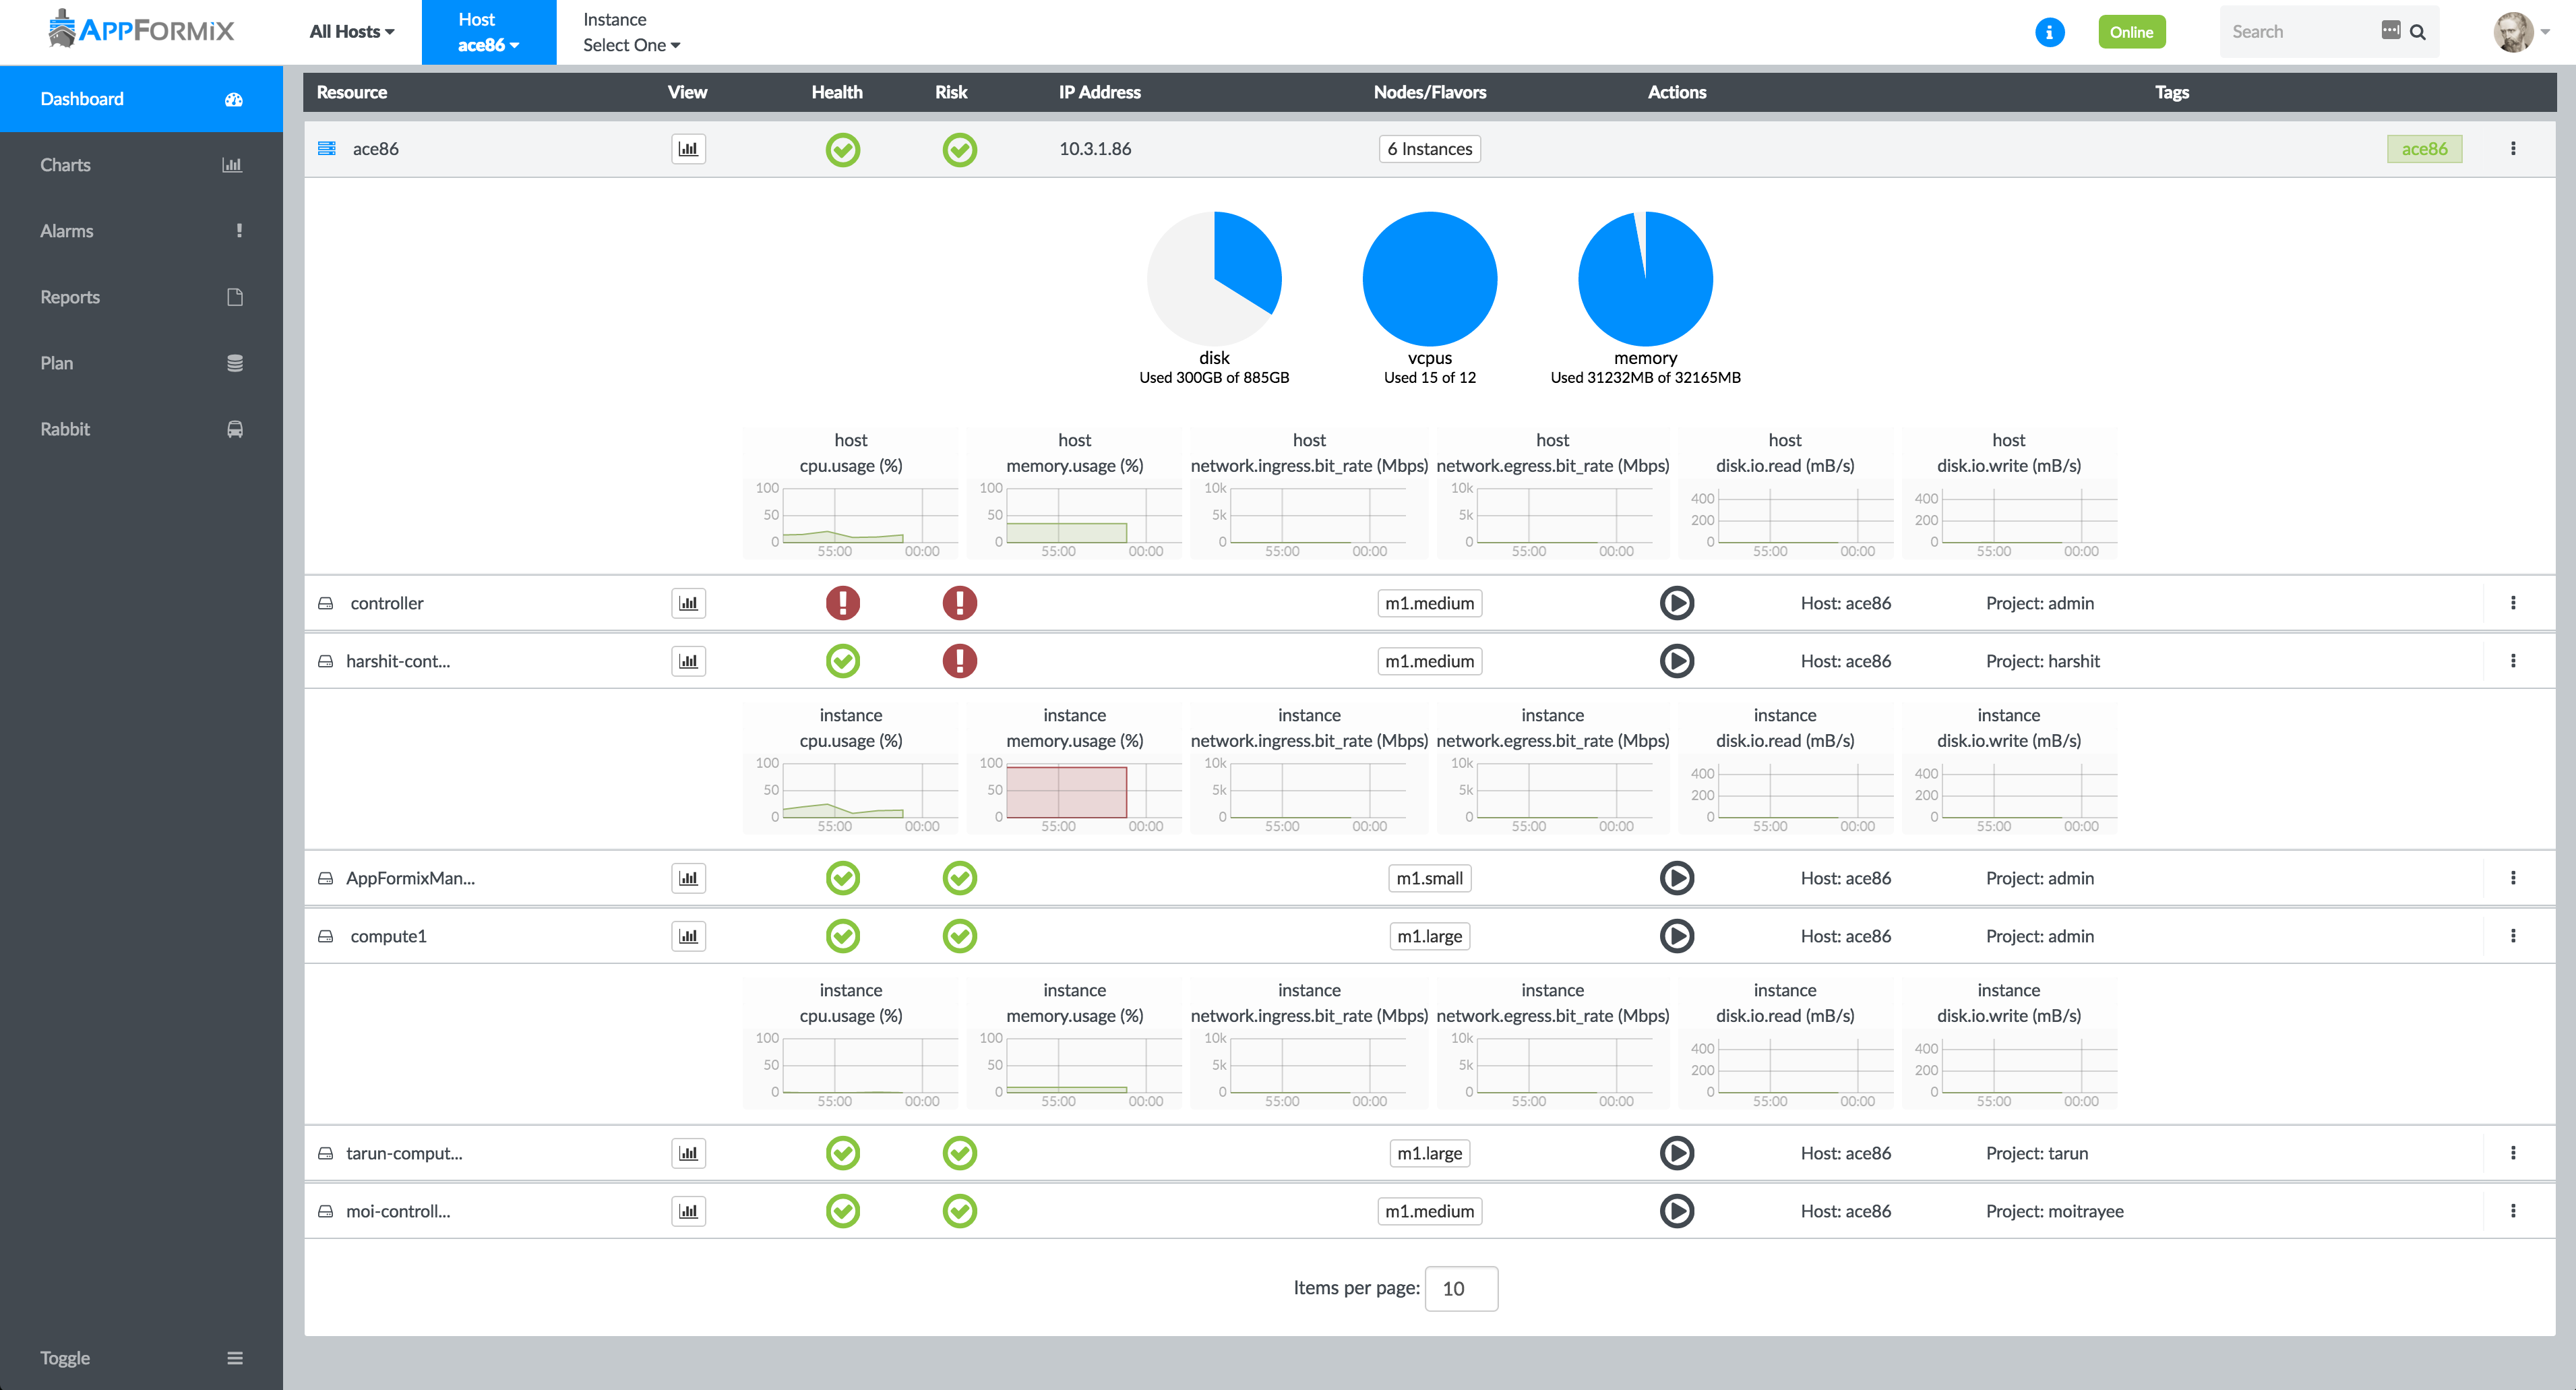
Figure 4 shows the instances for host resources at a glance in the dashboard.