Step 2: Up and Running
Now that you've deployed the Lightweight Collector (LWC), let’s get you up and running with Juniper Support Insights (JSI) on Juniper Support Portal!
Access Juniper Support Insights
To access Juniper Support Insights (JSI), you must register on the User Registration portal. You also require a user role (Admin or Standard) assigned. To get a user role assigned, contact Juniper Customer Care or your Juniper Services team.
JSI supports the following user roles:
- Standard—The Standard users can view the device onboarding details, operational dashboards, and reports.
- Admin— The Admin users can onboard devices, perform JSI management functions, view the operational dashboards and reports.
-
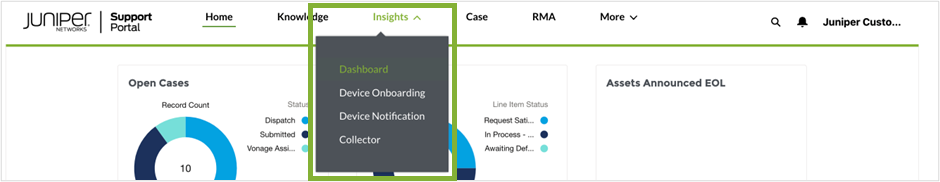
On the Insights menu, click:
- Dashboards to view of a set of operational dashboards and reports.
- Device Onboarding to perform device onboarding to initiate data collection.
- Device Notifications to view notifications about device onboarding, data collection, and errors.
- Collector to view the details of the LWC associated with the account.
View the Lightweight Collector Connection Status
You can view the Lightweight Collector (LWC) connection status on the following portals:
-
Juniper Support Portal
-
The LWC captive portal. The captive portal provides a more detailed view, and has options that let you change the LWC configuration settings and perform troubleshooting.
View the Connection Status on Juniper Support Portal
Here's how to view the LWC connection status on Juniper Support Portal:
View the Connection Status on the Captive Portal
See Configure the Lightweight Collector for more information.
Onboard Devices
You must be an admin user to onboard a device.
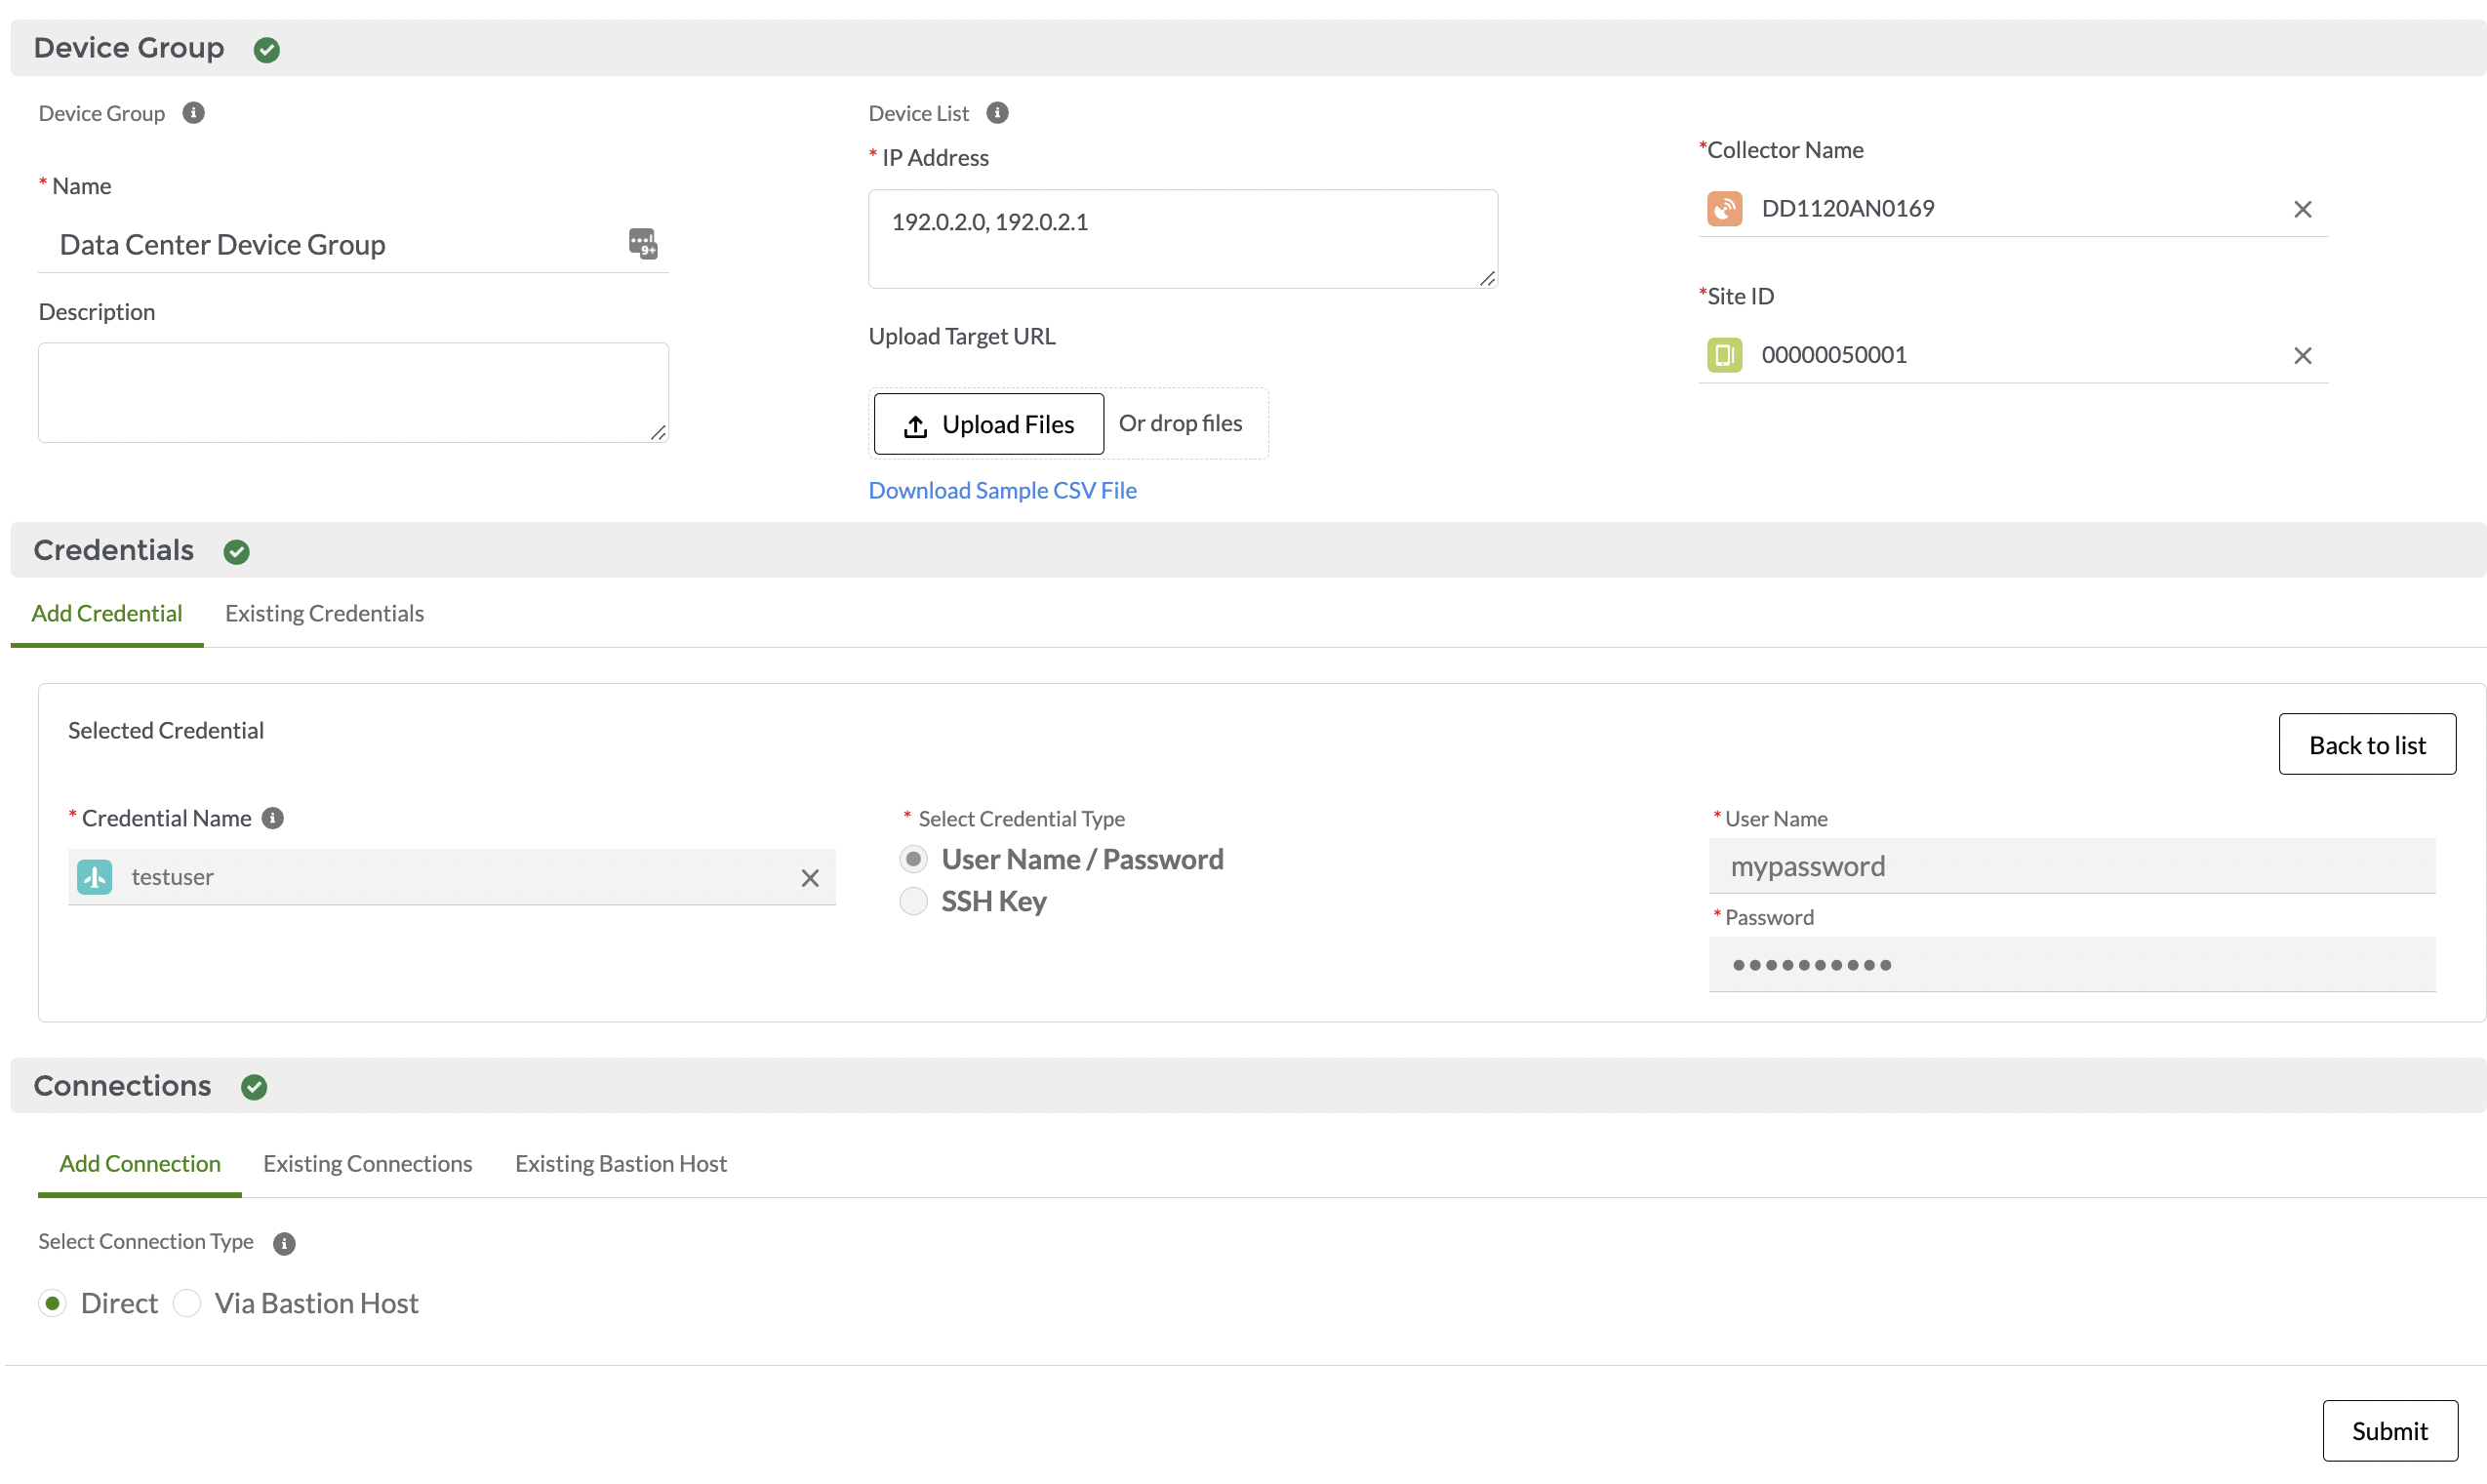
Here's how to onboard devices to JSI:
-
Click New Device Group. The following image
represents the device onboarding page with some sample data filled in.
View Notifications
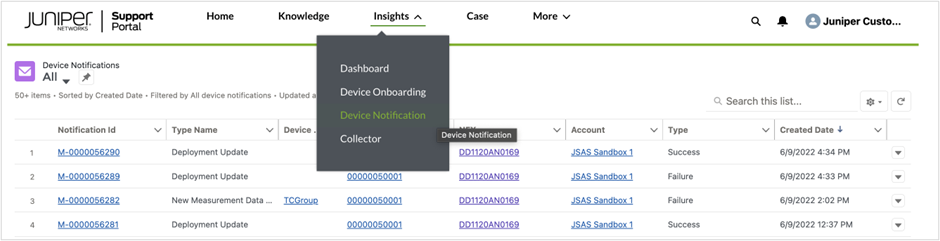
Here's how to view notifications on Juniper Support Portal:
-
Click a Notification ID to view the content of the
notification.
View Operational Dashboards and Reports
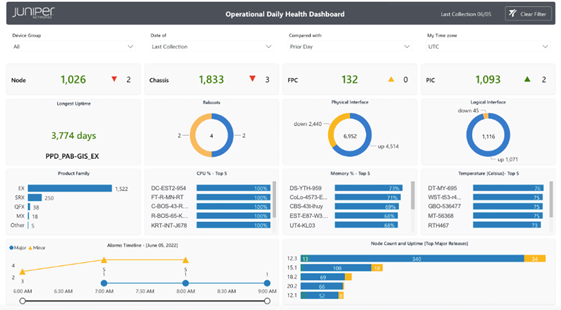
The JSI operational dashboards and reports are dynamically updated based on a periodic (daily) device data collection, which is initiated when you onboard a device. The dashboards and reports provide a set of current, historic, and comparative data insights into the devices' health, inventory, and lifecycle management. The insights include the following:
-
Software and hardware systems inventory (chassis to component level detail covering serialized and non-serialized items).
-
Physical and logical interface inventory.
-
Configuration change based on commits.
-
Core files, alarms, and Routing Engine health.
-
End of Life (EOS) and End of Service (EOS) exposure.
Juniper manages these operational dashboards and reports.
Here's how to view the dashboards and reports on Juniper Support Portal:
-
Click Insights >
Dashboard.
The Operational Daily Health Dashboard is displayed. This dashboard includes charts that summarize the KPIs associated with the account, based on the last collection date.
-
From the Reports menu on the left, select the
dashboard or report you want to view.
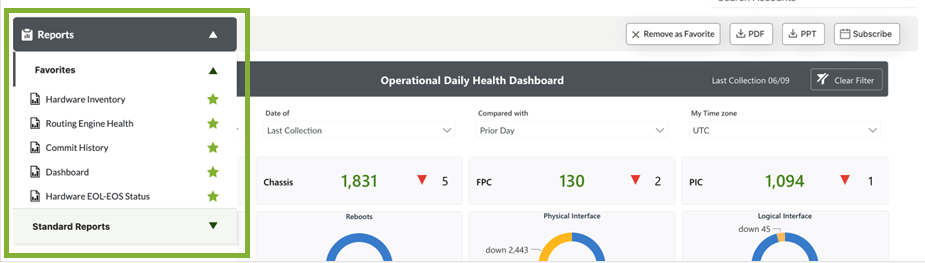
The reports typically consist of a set of filters, an aggregated summary view, and a detailed tabular view based on the data collected. A JSI report has the following features:
- Interactive views—Organize the data in a meaningful way. For example, you can create a segmented view of the data, click through, and mouse-over for additional details.
- Filters—Filter data based on your requirements. For example, you can view data specific to one or more device groups for a specific collection date and a comparison period.
- Favorites—Tag reports as favorites for ease of access.
- Email Subscription—Subscribe to a set of reports to receive them at a daily, weekly, or monthly frequency.
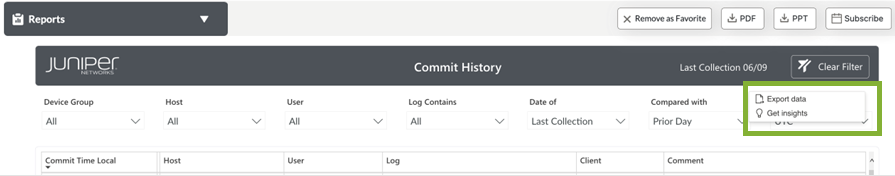
- PDF, PTT, and Data formats—Export the reports as PDF or PTT files, or in data format. In data format, you can download the report fields and values for each report component (for example, chart or table) by using the Export Data option as shown below: