ON THIS PAGE
JSA Events and Flows
The core functions of JSA are managing network security by monitoring flows and events.
A significant difference between event and flow data is that an event, which typically is a log of a specific action such as a user login, or a VPN connection, occurs at a specific time and the event is logged at that time. A flow is a record of network activity that can last for seconds, minutes, hours, or days, depending on the activity within the session. For example, a web request might download multiple files such as images, ads, video, and last for 5 to 10 seconds, or a user who watches a Netflix movie might be in a network session that lasts up to a few hours. The flow is a record of network activity between two hosts.
Events
JSA accepts event logs from log sources that are on your network. A log source is a data source such as a firewall or intrusion protection system (IPS) that creates an event log.
JSA accepts events from log sources by using protocols such as syslog, syslog-tcp, and SNMP. JSA can also set up outbound connections to retrieve events by using protocols such as SCP, SFTP, FTP, JDBC, Check Point OPSEC, and SMB/CIFS.
Event Pipeline
Before you can view and use the event data on the JSA console, events are collected from log sources and then processed by the Event Processor. JSA All-in-One appliance functions as the Event Collector and Event Processor, in addition to fulfilling the role of the JSA console.
JSA can collect events by using a dedicated Event Collector appliance, or by using an All-in-One appliance where the event collection service and event processing service runs on the All-in-One appliance.
The following diagram shows the layers of the event pipeline.
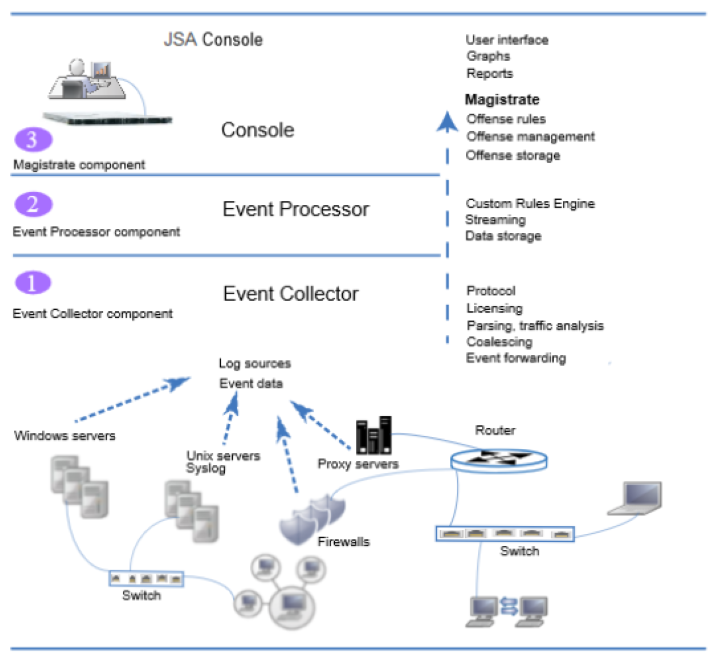
Event collection--The Event Collector component completes the following functions:
Protocol
Collects data from log source protocols such as Syslog, JDBC, OPSEC, Log File, and SNMP.
License throttling
Monitors the number of incoming events to the system to manage input queues and EPS licensing.
Parsing
Takes the raw events from the source device and parses the fields into a JSA usable format.
Log source traffic analysis and auto discover
Applies the parsed and normalized event data to the possible DSMs that support automatic discovery.
Coalescing
Events are parsed and then coalesced based on common attributes across events.
Event forwarding
Applies routing rules for the system to forward data to offsite targets, external Syslog systems, JSON systems, and other SIEMs.
When the Event Collector receives the events from log sources such as firewalls, the events are placed into input queues for processing.
The queue sizes vary based on the protocol or method that is used, and from these queues, the events are parsed and normalized. The normalization process involves turning raw data into a format that has fields such as IP address that JSA can use.
JSA recognizes known log sources by the source IP address or host name that is contained in the header.
JSA parses and coalesces events from known log sources into records. Events from new or unknown log sources that were not detected in the past are redirected to the traffic analysis (auto detection) engine.
When new log sources are discovered, a configuration request message to add the log source is sent to the JSA console. If auto detection is disabled, or you exceed your log source licensed limit, the new log sources are not added.
Event processing--The Event Processor component completes the following functions:
Custom Rules Engine (CRE)
The Custom Rules Engine (CRE) is responsible for processing events that are received by JSA and comparing them against defined rules, keeping track of systems involved in incidents over time, generating notifications to users. When events match a rule, a notification is sent from the Event Processor to the Magistrate on the JSA console that a specific event triggered a rule. The Magistrate component on the JSA console creates and manages offenses. When rules are triggered, responses or actions such as notifications, syslog, SNMP, email messages, new events, and offenses are generated.
Streaming
Sends real-time event data to the JSA console when a user is viewing events from the Log Activity tab with Real time (streaming). Streamed events are not provided from the database.
Event storage (Ariel)
A time-series database for events where data is stored on a minute by minute basis. Data is stored where the event is processed.
The Event Collector sends normalized event data to the Event Processor where the events are processed by Custom Rules Engine (CRE). If events are matched to the CRE custom rules that are predefined on the JSA console, the Event Processor executes the action that is defined for the rule response.
Magistrate on the JSA console--The Magistrate component completes the following functions:
Offense rules
Monitors and acts on offenses, such as generating email notifications.
Offense management
Updates active offenses, changes statuses of offenses, and provides user access to offense information from the Offenses tab.
Offense storage
Writes offense data to a Postgres database.
The Magistrate Processing Core (MPC) is responsible for correlating offenses with event notifications from multiple Event Processor components. Only the JSA console or All-in-One appliance has a Magistrate component.
Flows
JSA flows represent network activity by normalizing IP addresses, ports, byte and packet counts, and other data, into flow records, which effectively are records of network sessions between two hosts. The component in JSA that collects and creates flow information is known as Flow Processor.
JSA Flow collection is not full packet capture. For network sessions that span multiple time intervals (minutes), the flow pipeline reports a record at the end of each minute with the current data for metrics such as bytes, and packets. You might see multiple records (per minute) in JSA with the same "First Packet Time" but the "Last Packet Time" values increment through time.
A flow starts when the flow processor detects the first packet that has a unique source IP address, destination IP address, source port, destination port, and other specific protocol options, including 802.1q VLAN fields.
Each new packet is evaluated. Counts of bytes and packets are added to the statistical counters in the flow record. At the end of an interval, a status record of the flow is sent to a Flow Processor and statistical counters for the flow are reset. A flow ends when no activity for the flow is detected within the configured time.
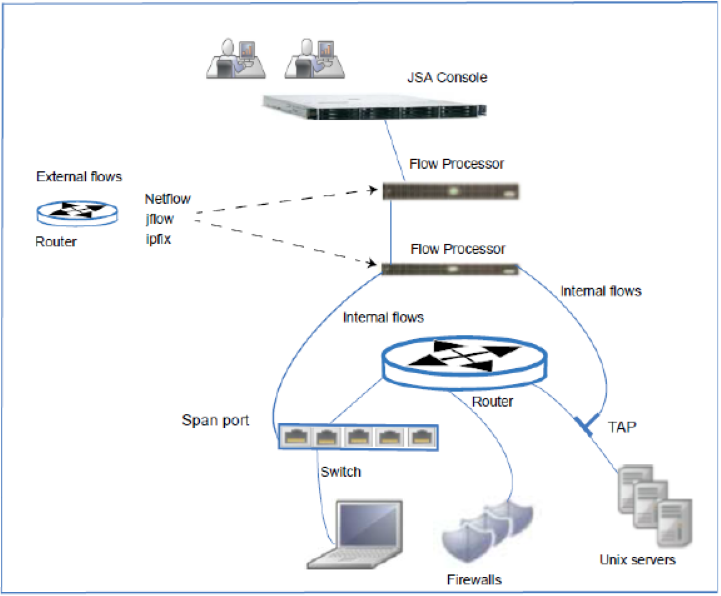
Flow Processor can process flows from the following internal or external sources:
External sources are flow sources such as netflow, sflow, jflow. External sources can be sent to a dedicated flow processor or to a Flow Processor appliance. External sources do not require as much CPU processing because every packet is not processed to build flows. In this configuration, you might have a dedicated flow processor and a Flow Processor that both receive and create flow data. In smaller environments (less than 50 Mbps), an All-in-One appliance might handle all the data processing.
The flow processor collects internal flows by connecting to a SPAN port, or a network TAP. The JSA Flow Processor can forward full packets from it's capture card to a packet capture appliance but it does not capture full packets itself.
The following diagram shows the options for collecting flows in a network.
Flow Pipeline
The flow processor generates flow data from raw packets that are collected from monitor ports such as SPANs, TAPs and monitor sessions, or from external flow sources such as netflow, sflow, jflow. This data is then converted to JSA flow format and sent down the pipeline for processing.
The Flow Processor runs the following functions:
Flow deduplication
Flow deduplication is a process that removes duplicate flows when multiple flow processors provide data to Flow Processors appliances.
Asymmetric recombination
Responsible for combining two sides of each flow when data is provided asymmetrically. This process can recognize flows from each side and combine them in to one record. However, sometimes only one side of the flow exists.
License throttling
Monitors the number of incoming flows to the system to manage input queues and licensing.
Forwarding
Applies routing rules for the system, such as sending flow data to offsite targets, external Syslog systems, JSON systems, and other SIEMs.
Flow data passes through the Custom Rules Engine (CRE), and it is correlated against the rules that are configured, and an offense can be generated based on this correlation. You view offenses on the Offenses tab.