ON THIS PAGE
Router Events
Router Events Graph
The Router Events graph displays count of router events, total bytes transmitted and received by a router, and data rate in a time series graph.
To view the router events graph, navigate to Organization > Inventory > Routers > Router Name > Router Insights or Routers > Router Name > Router Insights.
You can move the slider across the graph. A pop-up on the slider displays the time interval, date, total number of bytes transmitted and received by the router, and data rate during the time period. Colored vertical lines on the graph indicate various router event types. See Router Events Table to know the legend for classification of event types. A box below the event line represents the number of events for that type.
You can view the graph legend on the graph to interpret the plotted lines. You can drag an area of interest to zoom in to the graph.
Router Events Table
Router Events that occur on a router are classified into good, neutral and bad events depending on their impact on device performance and network traffic. Router Events table displays occurred router events, in a tabular form based on this classification.
To view the router events table, navigate to Organization > Inventory > Routers > Router Insights.
Click on the individual tabs (Total, Good, Neutral, and Bad) in the table to view the list of events of a particular event type. The list also displays the date and time at which the event occurred. Click on an individual event in the events list to know the details such as model number, OS version, administration information, configuration details, and configuration differences (in case of the configuration events).
You can customize Router Events table to view the events that you choose. Click the table setting icon to choose the router events that you want to view. Click All Events to view all the events occurred on a router.
Router Events are classified as following:
-
Good─A good event indicates that a router is functioning optimally and as configured. For example, Port Up, Configured and Reconfigured are good events.
Good events are marked in green in the table.
-
Neutral─A Neutral event indicates that the event has no impact on the network and traffic. For example, Unclaimed and Unassigned are neutral events.
Neutral events are marked in amber in the table.
-
Bad─A bad event indicates that the event has an impact on the network and traffic. You must resolve a bad event immediately. For example, Port Down and OSPF Neighbor Down are bad events.
Bad events are marked in red in the table.
To view configuration change, click a Configured event. Then click, View Details. Configuration Diff page appears displaying the configuration changes. Newly added configurations are highlighted in green, removed configurations are highlighted in red and modified configurations are highlighted in amber.
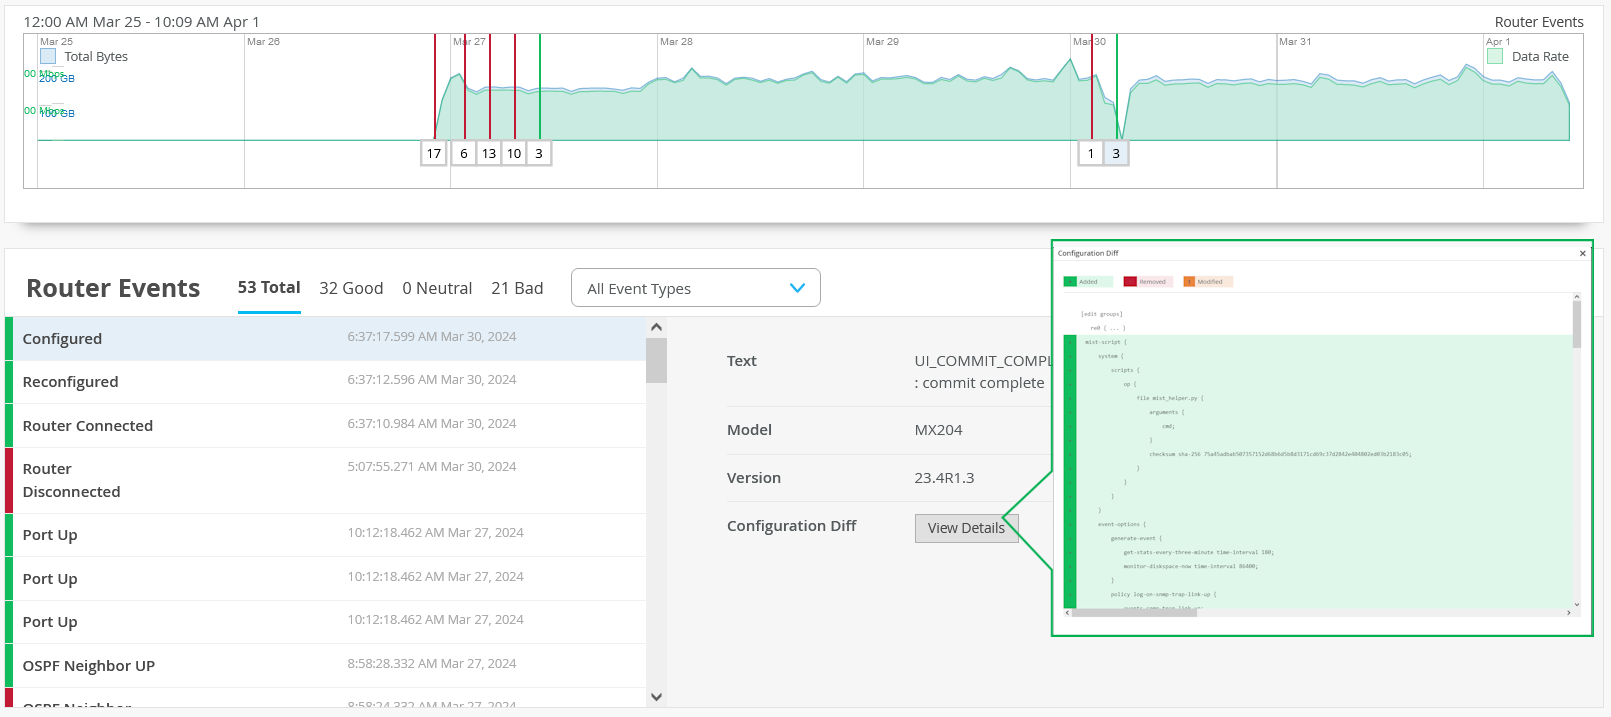
Table 1 lists the fields in the Router Events table.
|
Field |
Description |
|---|---|
|
Total |
Total number and list of events (good, neutral and bad) occurred during an interval. |
|
Good |
Number and list of good events that occurred during an interval. |
|
Neutral |
Number and list of neutral events that occurred during an interval. |
|
Bad |
Number and list of bad events that occurred during an interval. |