Site-Level Aggregation of Router Events
Juniper Routing Assurance enables administrators to view aggregated router events at the site level. The site-level router events time-series graph and the site-level router events table provide visualizations of router events that occurred during a specific period. As an administrator, you can use these visualizations to assess and compare router performance across different sites. Administrators can also filter and view router events by router and by event category.
Router Events are classified as follows:
-
Good─A good event indicates that a router is functioning optimally and as configured. For example, Port Up, Configured and Reconfigured are good events.
-
Neutral─A Neutral event indicates that the event has no impact on the network and traffic. For example, Unclaimed and Unassigned are neutral events.
-
Bad─A bad event indicates that the event has an impact on the network and traffic. You must resolve a bad event immediately. For example, Port Down and OSPF Neighbor Down are bad events.
To view aggregated router events at site-level, navigate to Monitor > Service Levels > Insights. Click the site drop-down list to select a site. The page displays router events for the selected site.
Select a time interval from the time range drop-down list. The router events graph and the router events table display information for the data collected during the selected interval. Select Custom Date to view router events for a specific date range. Select Custom Range to view router events for a specific date and time range.
The page can be viewed in five different languages─English, Spanish, Japanese, French and German. Select your preferred language from the Change language drop-down list.
For a selected site, the widget Routers displays the total number of routers onboarded to Juniper Routing Assurance. The widget Connected Routers displays the number of routers that are in connected state in Juniper Routing Assurance.
Router Events Time Series Graph
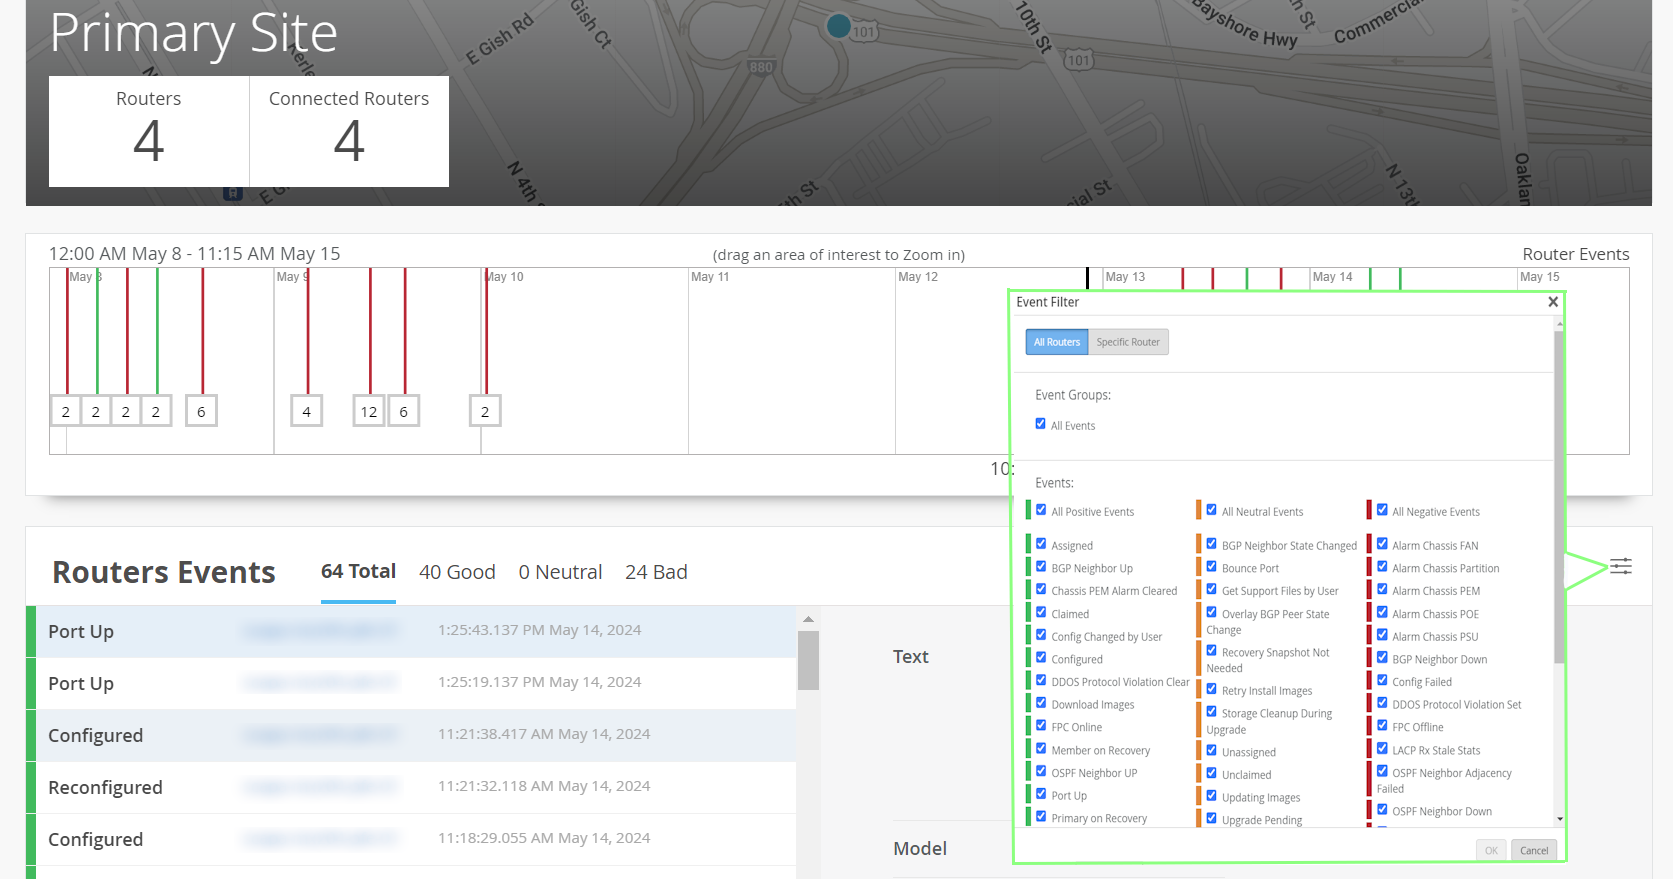
The Router Events graph displays the count of router events from all routers at the selected site, in a time series graph.
You can move the slider across the graph. If you click and drag the slider, the graph displays events that occurred during the selected time range. Colored vertical lines on the graph indicate various router event types. See Router Events to know the legend for classification of event types. A box below the events line represents the number of events for that type. You can drag an area of interest to zoom in to the graph.
Site-level Router Events Table
Router Events are classified into good, neutral and bad events depending on their impact on performance of the device and the network traffic. Router Events table displays router events that occurred at a site, in a tabular form based on this classification.
You can filter the events that are displayed in the Router Events table to show specific event types. Click the table setting icon to choose the router events that you want to view for a selected site. Click All Events to view all the events that occurred at that site.
You can also view router events for a specific router or routers in a site. Click Specific Router and then click the add icon to add routers for which you want to view the events.
Click on the individual tabs (Total, Good, Neutral, and Bad) in the table to view the list of events of a particular event type. The list also displays the router name, date, and time at which the event occurred. Click on an individual event in the events list to know the details such as model number, OS version, and operational status information. Click a router name to view insights from that router. For more information on classification of router events, see Router Events Table.
The Tab (Total, Good, Neutral, and Bad) can display up to 1000 events on a tab. If there are more than 1000 events, click the > (next page) and the < (previous page) icons to navigate to the next page and previous page, respectively in the tab.
The time series graph displays the first 1000 (or less) events contained in the selected tab.