Router Health SLE
To access the Router Health SLE page, navigate to Monitor > Service Levels > Routing > Router Health.
The Router Health SLE continuously monitors a router health's KPIs such as temperature, memory utilization, reachability and so on. When these KPIs cross a predefined threshold, Juniper Routing Assurance records failure minutes. Failure minutes is the duration in minutes during which the router health was degraded. It then performs root cause analysis and identifies the specific classifiers that caused the failures. The Router Health SLE provides visualizations of these classifiers and enables administrators to evaluate the end-user experience on the network.
What Does the Router Health SLE Measure?
The Router Health SLE measures the percentage of time when the router health was optimal and is a measure of its ability to transmit and to receive traffic.
Classifiers
A classifier is a parameter that indicates whether a router is performing optimally. When the router health's success threshold is not met, Juniper Routing Assurance collects and classifies the factors contributing to failures, into classifiers. The router health SLE monitors the following classifiers (also referred to as health indicators):
-
Router Unreachable─The router unreachable classifier measures the duration for which the router was unreachable. Use this classifier to know the percentage (ranging from 0 through 100) of time, router unreachability contributed to a lower Router Health SLE score.
-
Network─The network classifier monitors minutes when the throughput is lower than expected due to uplink capacity limitations. It identifies issues based on the round-trip time (RTT) value of packets sent from the router to Juniper cloud. The Network classifier has two sub-classifiers that help you identify these issues:
-
WAN Jitter─Displays minutes affected by jitter. The jitter value is calculated by comparing the standard deviation of RTT within a small period (last 5 or 10 minutes) with the overall deviation of RTT over a longer period (day or week). Use this classifier to know the percentage of time (ranging from 0 through 100) network jitter contributed to failed router's health.
-
WAN Latency─Displays minutes affected by latency. The latency value is calculated based on the average value of RTT over a period of time. Use this classifier to know the percentage of time (ranging from 0 through 100) network latency contributed to failed router's health.
Note:If a router is unreachable for more than two days, then it stops contributing any bad minutes to the Router Health SLE. Once the router is reconnected to Juniper Routing Assurance, it will start contributing to the SLE again.
-
-
System─The System classifier has three sub-classifiers that help you identify these issues:
-
CPU─CPU consumption of a router. Use this classifier to know the percentage of time (ranging from 0 through 100) system CPU utilization contributed to failed router's health.
Configuration commits, BGP peer down, and BGP flapping are some of the reasons for CPU consumption spiking up.
Note:The CPU classifier has a threshold value of 90 percent.
-
Temperature─Temperature of a router. Use this classifier to know the percentage of time (ranging from 0 through 100) system temperature contributed to failed router's health. Failure of the cooling system or environmental factors could impact this classifier.
-
Memory─Memory consumption of a router. Use this classifier to know the percentage of time (ranging from 0 through 100) system memory contributed to failed router's health.
Note:The Memory classifier has a threshold value of 90 percent.
-
-
Capacity─The Capacity classifier monitors the highest usage capacity of routing on a router which includes the highest usage of the Routing Information Base (RIB) vs. the Forwarding Information Base (FIB), the highest usage within FIBs and, the highest usage of FIBs across all the FPCs and Packet Forwarding Engines (PFE). The Capacity classifier has two sub-classifiers:
-
Route Table─The route table capacity is the highest utilization of RIB and FIB. This sub-classifier displays the percentage of time (ranging from 0 through 100) the capacity of the route table contributed to failed router's health. See Routing Table Capacity to view RIB and FIB usage separately.
Note:The Route Table sub-classifier has a threshold of 80 percent.
-
ARP Table─Capacity of the Address Resolution Protocol (ARP) table. This sub-classifier displays the percentage of time (ranging from 0 through 100) the capacity of the ARP table contributed to failed router's health.
Note:The ARP Table sub-classifier has a threshold of 80 percent.
When you see a high amount of capacity usage, you must check the peer usage and the number of routes on each peer for that router. If you find any outliers here, contact your Juniper Support representative to resolve the issue.
-
Click the View Insights button to navigate to the Router Insights page and view router events at the site level. If you are viewing Router Health SLE for a specific router, the View Insights button will navigate you to the Router Insights page for that router.
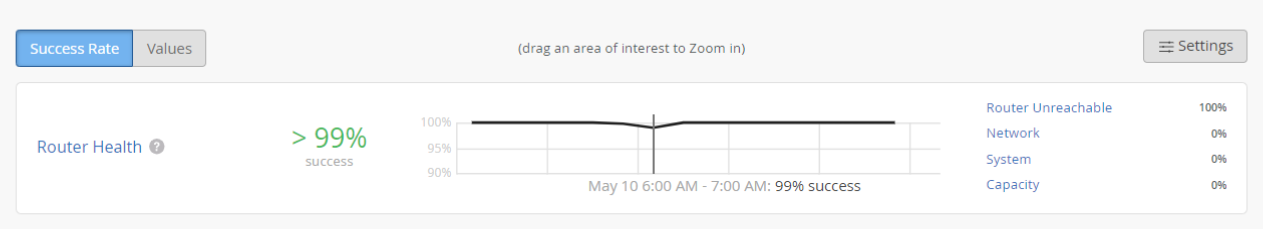
In Figure 1, the Router Health SLE met the service level goal for more than 99 percent of the time and Router Unreachable classifier contributed to failed router health 100 percent of the time. The network, system and capacity classifiers were at their best with 0 percent severity.
Analyze Router Health SLE Score
The root cause analysis page provides visualizations for distribution, timeline, statistics for service level failures and enables administrators to understand the scope of these issues.
Click the View Insights Tab to navigate to the Insights tab which gives you fine-grained details of the router events. You can now use the Insights tab to correlate router events that could have impacted the SLE. For example, a Config Changed router event might have caused the CPU to spike up during a specific period. A Router Disconnected router event might have contributed to Router Unreachable.
Click the Router Health widget to navigate to the root cause analysis page. Click each classifier to view its sub-classifiers.
-
Statistics─The Statistics tab displays the success rate of the SLE metric. Administrators can also view the distribution graph to understand the severity of the SLE with its impact duration. You can view the Statistics tab only when you click the Router Health widget.
The Router Health Success Rate indicates the percentage of time the router operated without degradation. It is calculated based on the duration for which the router operated optimally with respect to the total time it was monitored. For example, in Figure 2, the router operated optimally for 99 percent of the time and operated with degraded performance for 1 percent of the total time that it was monitored.
Figure 2: Root Cause Analysis of SLE Score 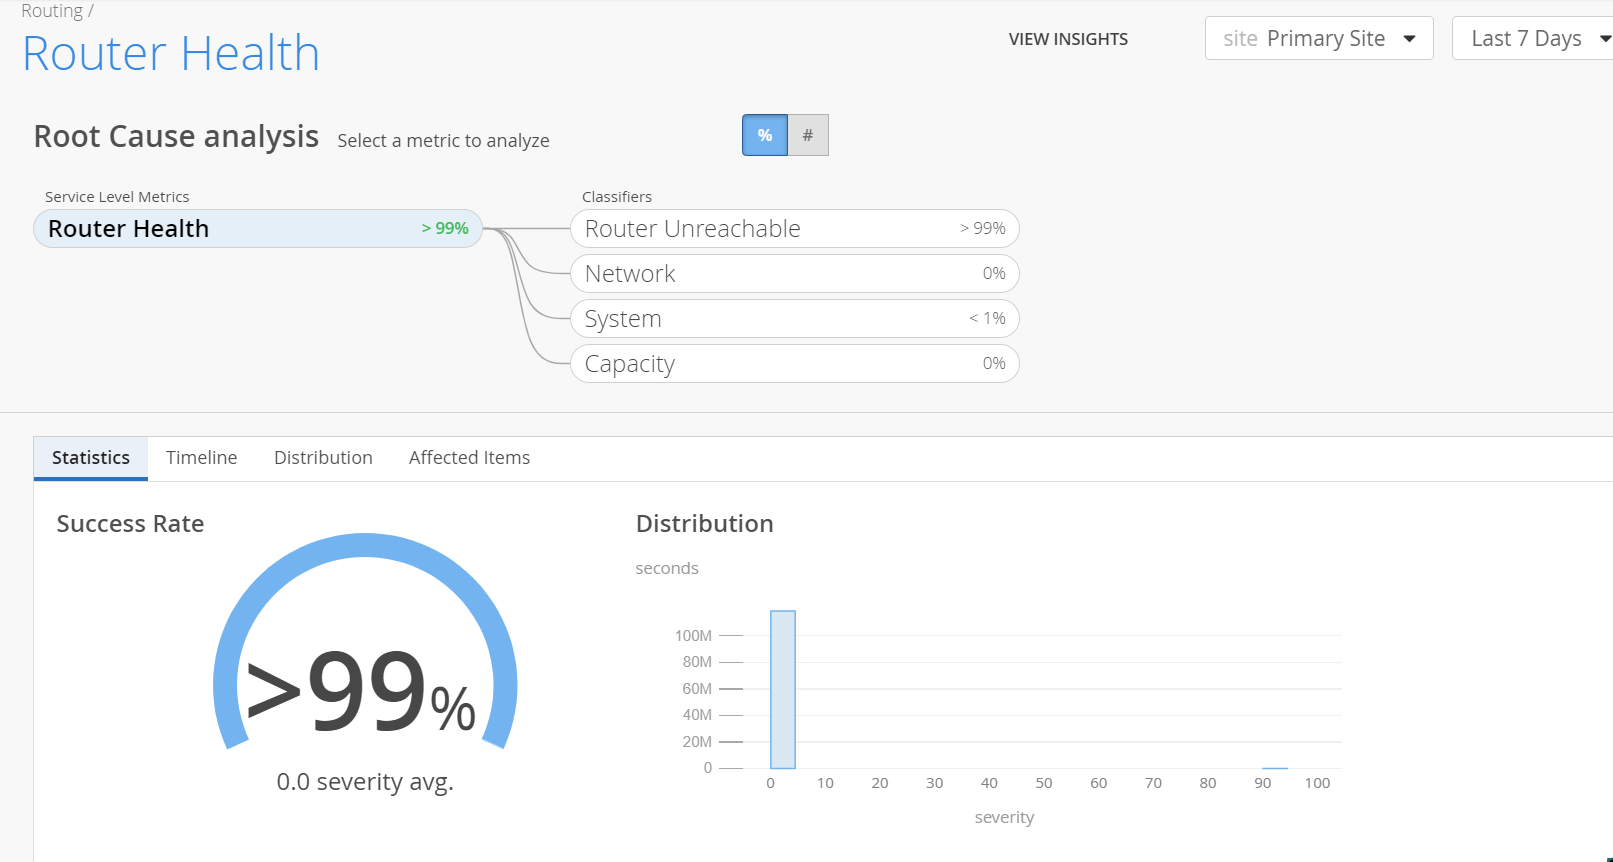
-
Timeline─The Timeline graph represents the trend of SLE failure minutes over a time period. You can move the slider across the graph.
You can view the timeline graph for an SLE, a classifier and also for a sub-classifier. As you mouse over the graph, a pop-up on the slider displays the failure minutes of every classifier and sub-classifier during the time period. Colored vertical bars on the graph indicate various classifiers and sub-classifiers.
You can view the graph legend on the graph to interpret the plotted lines. Drag an area of interest to zoom in to the graph.
Figure 3: Timeline 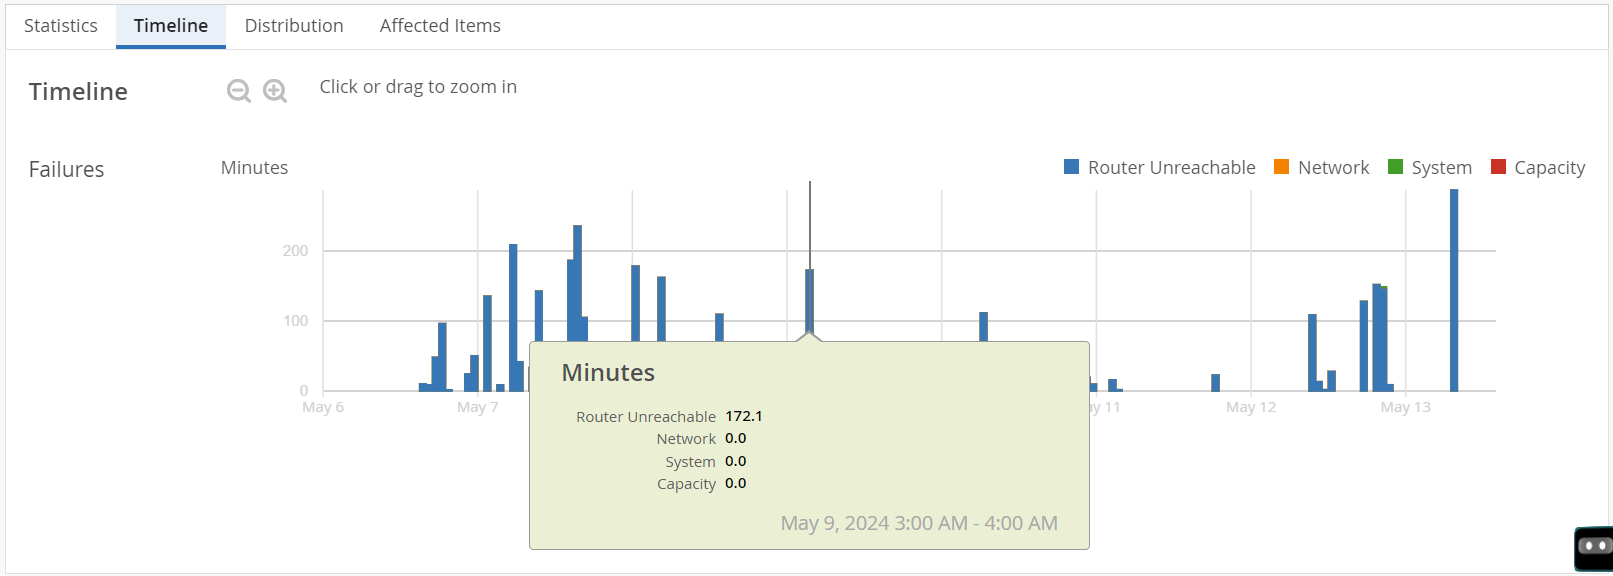
-
Distribution─Use the distribution tab to analyze service level failures by various attributes such as overall impact, failure rate and anomaly. The distribution tab displays these attributes for all the routers connected at the selected site.
You can sort the columns in the table by the column header. Click any column header to sort its entries. By default, the attributes are sorted by most anomalous.
In Figure 4, Router A was responsible for 4 percent of all failures across the site. The router failed 1% of the time. It has an anomaly factor of 2.96, which means that this router has a failure rate that is 2.96 times higher than the site average.
For field desciptions, see Table 1.
Table 1: Fields on the Distribution Tab Fields
Description
Name
Name of the Router.
Overall Impact
Contribution (in percentage) of a router’s failure minutes to the total failure minutes of all the routers at a specific site.
This helps you identify routers with disproportionately long durations of failure.
Failure Rate
Router failure rate (in percentage).
Failure rate is a measure of the failure minutes of a router with respect to the total monitored time.
Anomaly
A correlation metric that compares a router’s individual failure rate to the average failure rate across the site.
It helps you identify routers that are underperforming or outperforming relative to other routers at a site.
The correlation coefficients are:
-
Anomaly > 1─Router has a higher failure rate than the network average (underperforming).
-
Anomaly < 1─Router has a lower failure rate than the network average. This means that the router is healthier than the network average.
-
Anomaly = 1─Router is performing in line with the network average.
Figure 4: Distribution 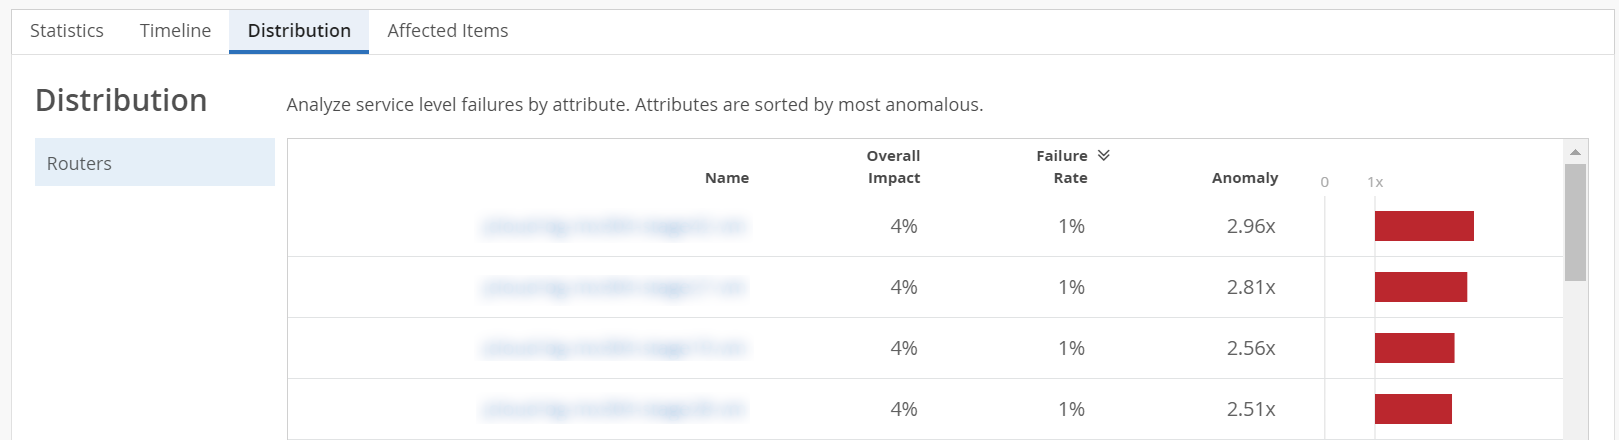
-
-
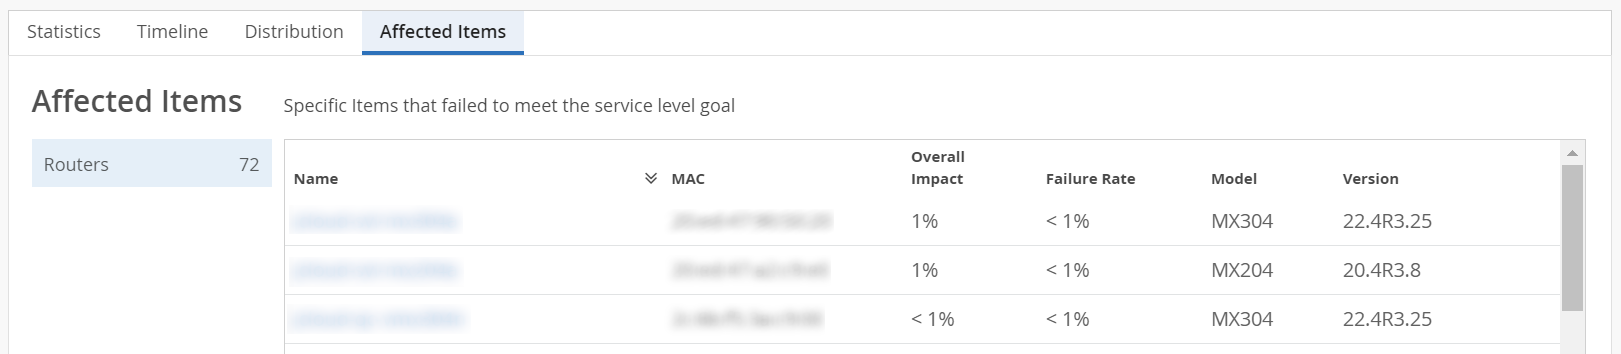
Affected Items─The Affected items tab lists all routers that failed to meet the service level goal. From this tab, you can view the affected routers' details such as MAC address, model number, failure rate and so on. The affected item tab also displays the count of routers that failed to meet the service level goal.
You can sort the columns in the table by the column header. Click any column header to sort its entries. Table 2 describes the fields on the Affected Items tab.
Click a router to view the RCA for a specific router. The RCA page now displays the SLE metrics for the router. Click the View Insights Tab to navigate to the Router Insights page. Use the Router Charts, the Router Interface Queues, and the BGP summary information of the router to debug the issues further.
Table 2: Fields on Affected Items Tab Fields
Description
Name
Name of the Router.
MAC
MAC address of the router.
Overall Impact
Indicates the contribution (in percentage) of a router’s failure minutes to the total failure minutes of all the routers at a specific site.
This helps identify routers with disproportionately long durations of failure.
Failure Rate
Router failure rate (in percentage).
Failure rate is a measure of the failure minutes of a router with respect to the total monitored time.
Model
Router model name.
Version
Version of Junos OS or Junos OS Evolved running on the router.
Figure 5: Affected Items