On-Box Aggregation Overview
Juniper devices support on-box aggregation. Interface, CoS, MPLS, AF, and AE counters are aggregated by the device, and the device then streams telemetry data to a collector. Compared to off-box aggregation, where counters are streamed to the collector and aggregated there, on-box aggregation provides more accurate telemetry data. On-box aggregation also recognizes systemic events, such as line card resets or LAG membership changes. On-box aggregation reduces production errors at the collector. It also significantly reduces the overall telemetry data bandwidth utilization in certain cloud-based environments where data is metered.
Aggregation Logic
Data aggregation is the simple addition of given counter values from all the Packet Forwarding Engine instances received as Google protobuf messages in the aggregation module processes. The aggregation module processes cache the statistics from multiple Packet Forwarding Engines based on the subscription request received. Caching is done per subscription received.
The following points apply to data aggregation:-
If statistical data is gauge type, field values will be either
Average,MaxorMin, and the aggregation module orders aggregation based on the gauge type field value. -
Aggregation is done for both counter and gauge data types annotated in the YANG file.
- At any time, there is only one source of data for a given Packet Forwarding Engine available in the cache. New entries overwrite the existing cache.
-
No separate timer aggregates or streams data. Whenever sample data is received from a Packet Forwarding Engine, the time to aggregate and stream is checked with the previously sent aggregated timestamp. For example:
-
current time stamp – previously aggregated time stamp > reporting_interval
-
The export timestamp carries a median timestamp for the aggregated data.
-
Record caching in the na-grpcd daemon is available only while the subscription is valid (active). When a subscription is inactive, the exported aggregated telemetry data might not match the Routing Engine command line interface statistics. The following triggers may create this mismatch:
-
Restart of one or more FPCs in which the child members are part of the aggregated interface.
-
Deletion of up to n-1 child members (at least one child link is active) from an aggregate interface.
-
-
Lastly, if the subscription is deleted, the associated cache also is deleted.
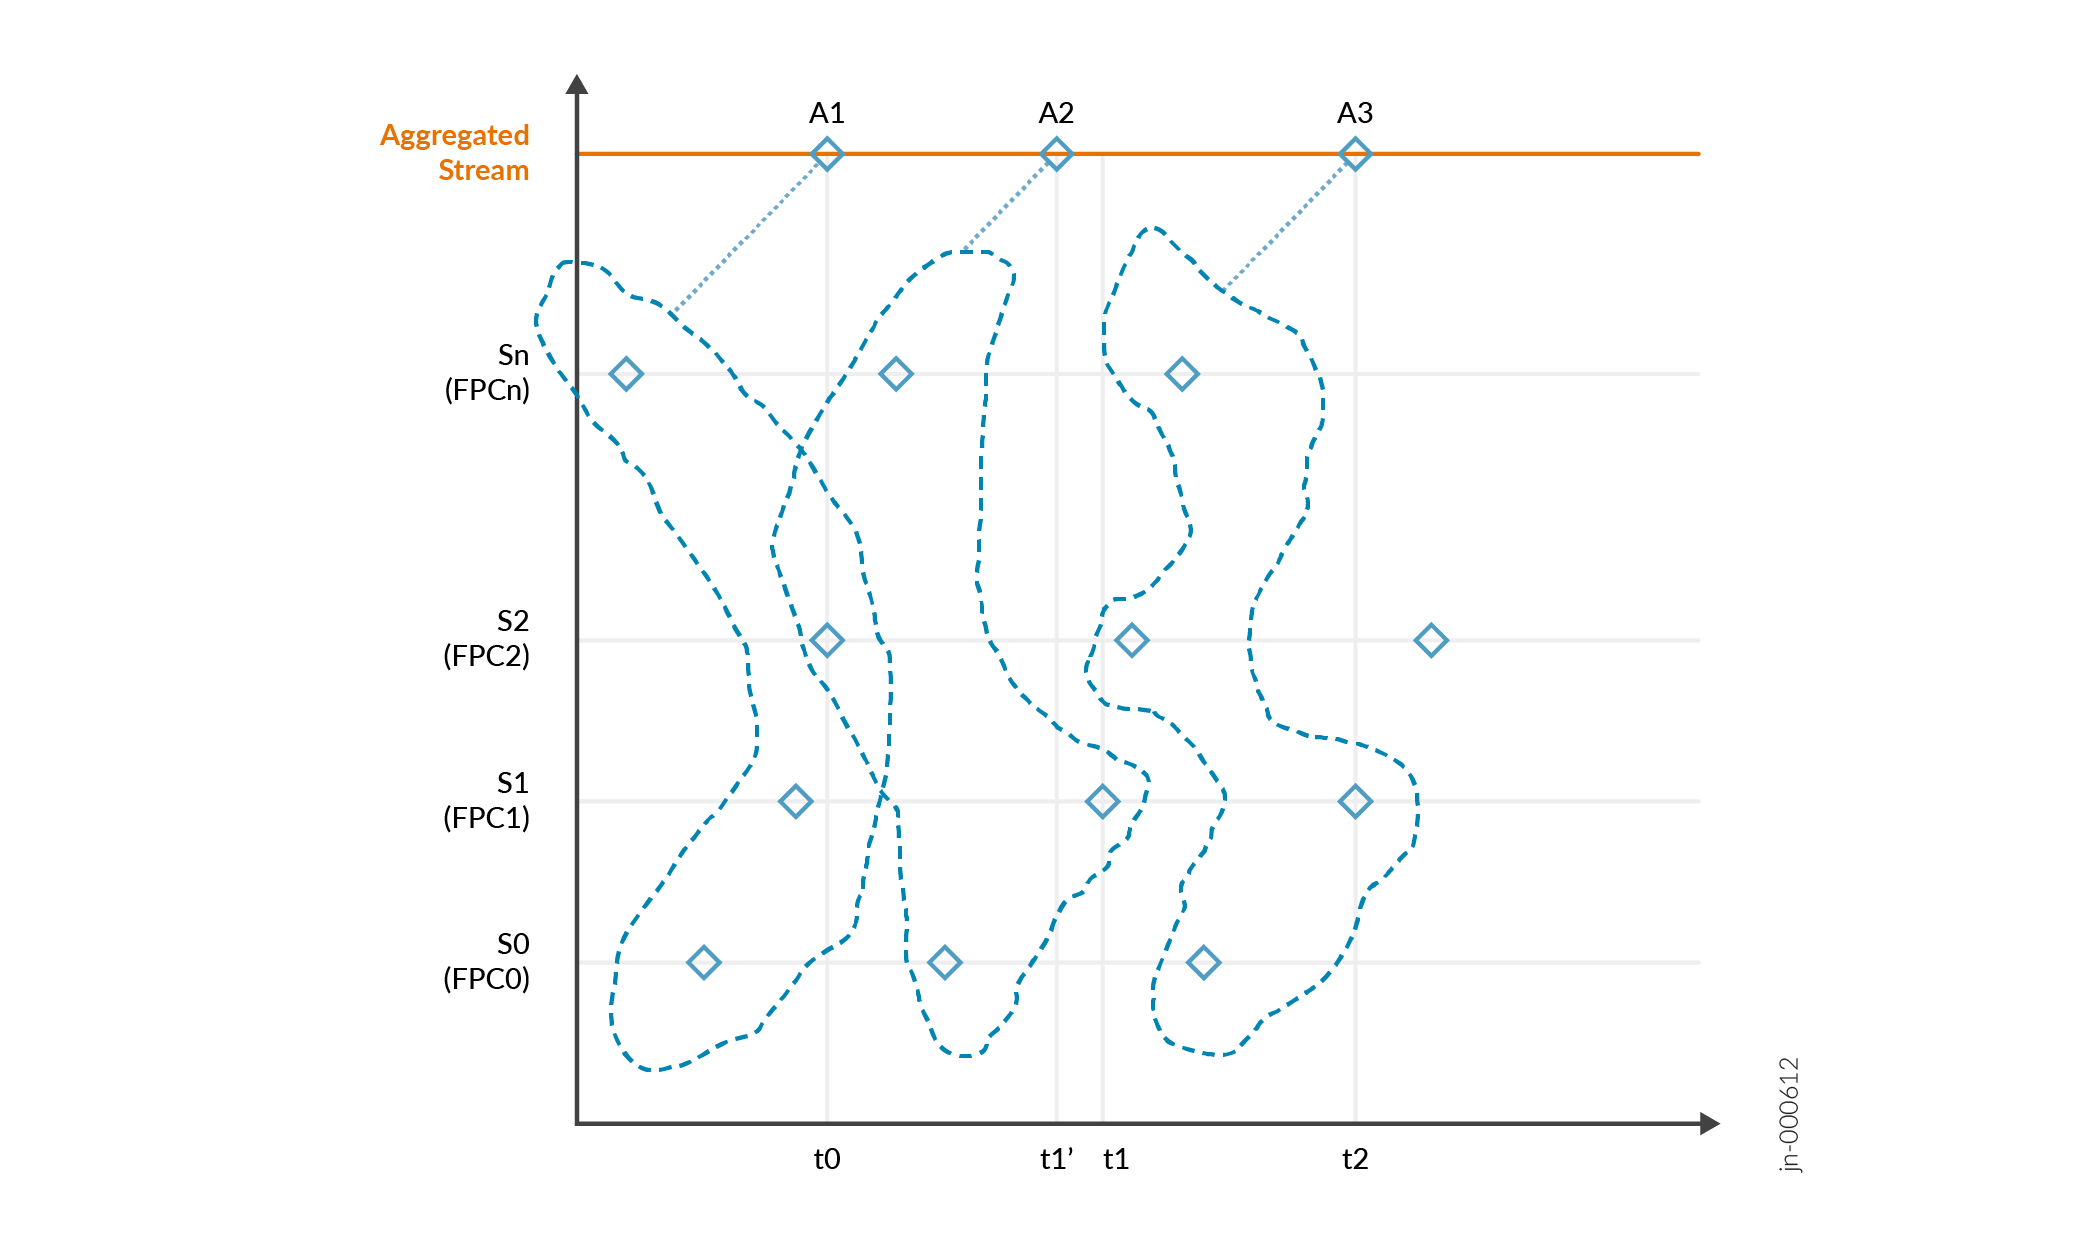
In a gNMI or gRPC stream, the first sample may not contain aggregated statistics counter values because the first interval from the Routing Engine may have only received one sample from multiple FPCs. However, from the second interval onwards, the stream will contain aggregated counter values received from all the FPCs.
Aggregation of samples is triggered based upon one of the incoming samples. Shown in Figure 1, sample S2 is delayed. Because of this delay, A2 aggregation uses the old t0 sample with a median timestamp of the samples. This is labeled t1' (though actually it is t1).
Packet Forwarding Engine Data Export
The aggregation feature relies on the fundamental protobuf-based telemetry interface to export data from the Packet Forwarding Engine. A protobuf-based telemetry stream encapsulates data for export in a common, top-level envelope called TelemetryStream (shown below).
message TelemetryStream {
    // router hostname
    // (or, just in the case of legacy (microkernel) PFEs, the IP address)
    required string system_id        = 1 [(telemetry_options).is_key = true];

    // line card / RE (slot number)
    optional uint32 component_id     = 2 [(telemetry_options).is_key = true];

    // PFE (if applicable)
    optional uint32 sub_component_id = 3 [(telemetry_options).is_key = true];

    // configured sensor name
    optional string sensor_name      = 4 [(telemetry_options).is_key = true];

    // sequence number, monotonically increasing for each
    // system_id, component_id, sub_component_id + sensor_name.
    optional uint32 sequence_number  = 5;

    // timestamp (milliseconds since 00:00:00 UTC 1/1/1970)
    optional uint64 timestamp        = 6 [(telemetry_options).is_timestamp = true];
…
}
This top-level envelope provides necessary information to build the Packet Forwarding Engine statistics cache in an operation called combinator. The combinator performs a logical join on multiple data instances that have a common interface ID and queue ID, and produces system-wide aggregated output queue statistics. Every incoming protobuf is organized into the cache using sensor, component and a Packet Forwarding Engine slot field in the TelemetryStream protobuf. The combinator keeps track of instance data per Packet Forwarding Engine by caching the latest protobuf export from the Packet Forwarding Engine for a specific sensor. Using binary protobuf as an aggregation unit ensures minimal caching and bookkeeping overhead for each collection of counters contained within the protobuf.
A timestamp on the telemetry data exported from the Packet Forward Engine triggers the aggregate data computation. If the elapsed time since the previous aggregate data export exceeds the sensor refresh interval, then a new aggregate value is exported. This new value uses the timestamp from the last Packet Forwarding Engine sample that triggered the aggregated value export. This method eliminates the need to run a per-sensor timer inside the combinator to reap aggregated data. Also, caching the last received data export from the Packet Forwarding Engine minimizes "drift" in the exported aggregate data. This is especially useful for instances such as a delayed Packet Forwarding Engine export as well as operational changes that can potentially preclude further export from the Packet Forwarding Engine.
Identifying Aggregated Data Samples
You can identify aggregated samples by the header field compoent with the value
na-grpcd. The na-grpcd daemon produces the aggregated data.
system_id: r1q13dep
component_id: 65535
sensor_name: sensor_1004_1_1
subscribed_path: /interfaces/interface/subinterfaces/subinterface/
streamed_path: /interfaces/interface/subinterfaces/subinterface/
component: na-grpcd
sequence_number: 2097152
export_timestamp: 1663783826926
update {
    timestamp: 1663783826901000000
    prefix: /interfaces/interface[name='ge-1/0/0']/subinterfaces/subinterface[index='16386']
update {
    path {
       elem {
          name:   init-time
       }
    }
    val {
      uint_val: 1663780730
       }
    }
Usage Tips
Keep the following considerations in mind when using on-box aggregation:
-
The packet and byte rates calculation is based on the aggregated statistics timestamp message. Since the timestamp message is synthesized on one Routing Engine, but is based on cached data from multiple FPCs, the packet and byte rate may not be accurate. Accuracy is higher when the reporting interval configuration is reasonable (as per best practices guidelines).
-
If statistics messages are not exported by the Packet Forwarding Engines (for example, the operational status is down), then aggregation statistics are not exported to the collector.
-
Expect telemetry MPLS LSP statistics with an AE bundle to have a 5% deviation in packet and byte rates.
Supported Resource Paths
On-box aggregations supports these resource paths:
-
/junos/system/linecard/interface/traffic/
-
/junos/system/linecard/interface/queue/
-
/junos/system/linecard/interface/logical/usage/
-
/junos/system/linecard/cos/interface/interface-set/output/queue/
-
/junos/services/label-switched-path/usage/
-
/qos/interfaces/interface/output/queues/queue/state/
-
/interfaces/interface/state/counters/
-
/interfaces/interface/subinterfaces/subinterface/state/counters/
-
/interfaces/interface/subinterfaces/subinterface/ipv4/state/counters/
-
/interfaces/interface/subinterfaces/subinterface/ipv6/state/counters/
-
/network-instances/network-instance/mpls/lsps/constrained-path/tunnels/tunnel/state/counters/
-
/junos/system/linecard/interface/queue/ (CoS native resource path)
-
/junos/system/linecard/qmon-sw/ (CoS native resource path)
-
/qos/interfaces/interface/output/queues/queue/state/ (CoS OpenConfig resource path)
-
/qos/interfaces/interface/input/virtual-output-queues/voq-interface/queues/queue/state/ (CoS OpenConfig resource path)
-
/junos/system/linecard/interface/queue/ (native path for physical interface statistics, AE interfaces supported)
-
/qos/interfaces/interface/output/queues/queue/state/ ( AE interfaces supported)
See Junos YANG Data Model Explorer for more information about resource paths, their supported leaves, and the device platforms that support them.
Change History Table
Feature support is determined by the platform and release you are using. Use Feature Explorer to determine if a feature is supported on your platform.