Switch Insights
Investigate issues affecting switches.
Finding the Switch Insights
Go to the Insights page, click the site menu at the top of the page, then click Switch on the left, and then click the switch that you want to view.
Switch Events
In the event list, click an event to see a summary on the right side of the page.
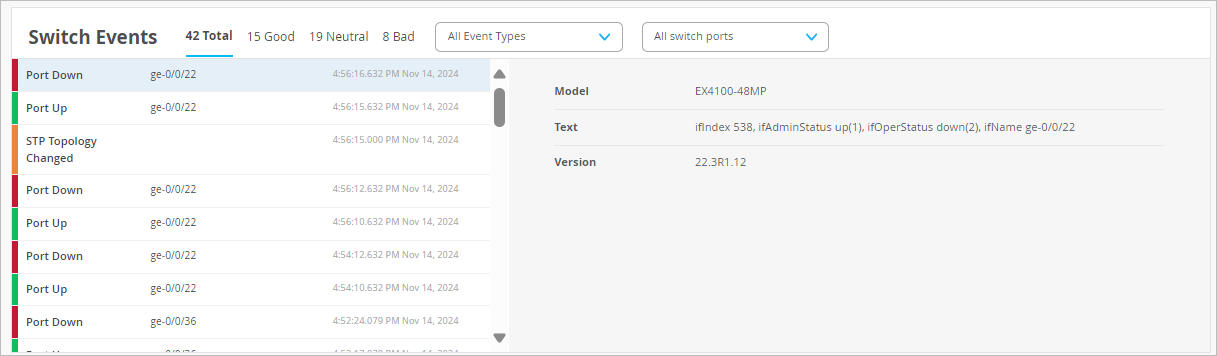
Other options:
-
Use the tabs at the top of this section to show all, good, neutral, or bad events.
-
Use the Event Types menu to show all events or select an event type. You can add multiple types, clicking them one by one. For more information, see Switch Event Types.
-
Use the Switch Ports menu to show all ports or select a port.
Switch Event Types
The Event Types options include:
-
Alarm Chassis FAN
-
Alarm Chassis Hot
-
Alarm Chassis Partition
-
Alarm Chassis PEM
Alarm Chassis POE
Alarm Chassis PSU
Alarm POE Controller Upgrade Available
Assigned
Auth Session Deleted
BFD Session Disconnected
BFD Session Established
BGP Neighbor Down
BGP Neighbor Up
Bounce Port
Chassis Alarm Cleared
Checksum Complete during ZTP
Checksum Error while downloading image via ZTP
Claimed
Config Changed by User
Config Failed
Configuration Applied via ZTP
Configuration Error in Additional CLI
Configured
DDOS Protocol Violation Clear
DDOS Protocol Violation Set
Download Images
Dynamic Port Profile Assigned
EVPN Core Isolated
EVPN Core Isolation Cleared
EVPN Duplicate Mac Detected
FPC Offline
FPC Online
Get Support Files
Get Support Files by User
HTTP error while downloading image via ZTP
Image download via ZTP Complete
Image installation via ZTP failed
Image installation via ZTP in progress
Image Installed
LACP Rx Stale Stats
MAC Limit Exceeded
MAC Limit Reset
Member on Recovery
Non DHCP Client Detected
OSPF Neighbor Adjacency Failed
OSPF Neighbor Down
OSPF Neighbor UP
Overlay BGP Peer State Change
Port BPDU Blocked
Port BPDU Error Cleared
Port Down
Port Storm Control
Port Up
Primary on Recovery
Radius Server Unresponsive
Reassigned
Recovery Snapshot Failed
Recovery Snapshot Not Needed
Recovery Snapshot Requested
Recovery Snapshot Succeeded
Recovery Snapshot Unsupported
Restart by User
Restarted
Retry Install Images
Rogue DHCP Server Detected
Software Connection Failed during ZTP
Starting to download image via ZTP
Storage Cleanup During Upgrade
STP Topology Changed
Switch Connected
Switch DHCP Pool Exhausted
Switch Disconnected
Switch Port Loop Detected
Switch Rebooting after Image Installation via ZTP
Unassigned
Unclaimed
Undefined Image Version for this Model
Updating Images
Upgrade Failed
Upgrade Pending
Upgraded by User
User Access Denied
User Authenticated
User Authenticated on Server Reject VLAN
User Disconnected Manually
User Session Deleted
User Session Disconnected
User Session Held
VC Backup Elected
VC Member Added
VC Member Deleted
VC Member Restarted
VC Primary Changed
Version Selected to Upgrade does not Support CloudX
Virtual Chassis Port Down
Virtual Chassis Port UP
ZTP Configuration Failed
ZTP Failed
ZTP Finished
ZTP Post Script Success
ZTP Pre Script Complete
ZTP Started
Table Capacity
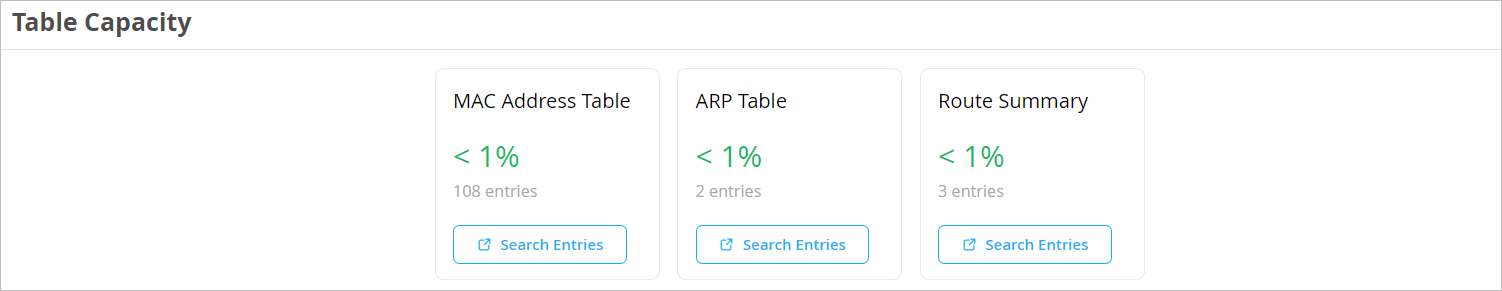
This section shows the utilization and the number of entries for these tables:
-
MAC Address Table
-
ARP Table
-
Route Summary
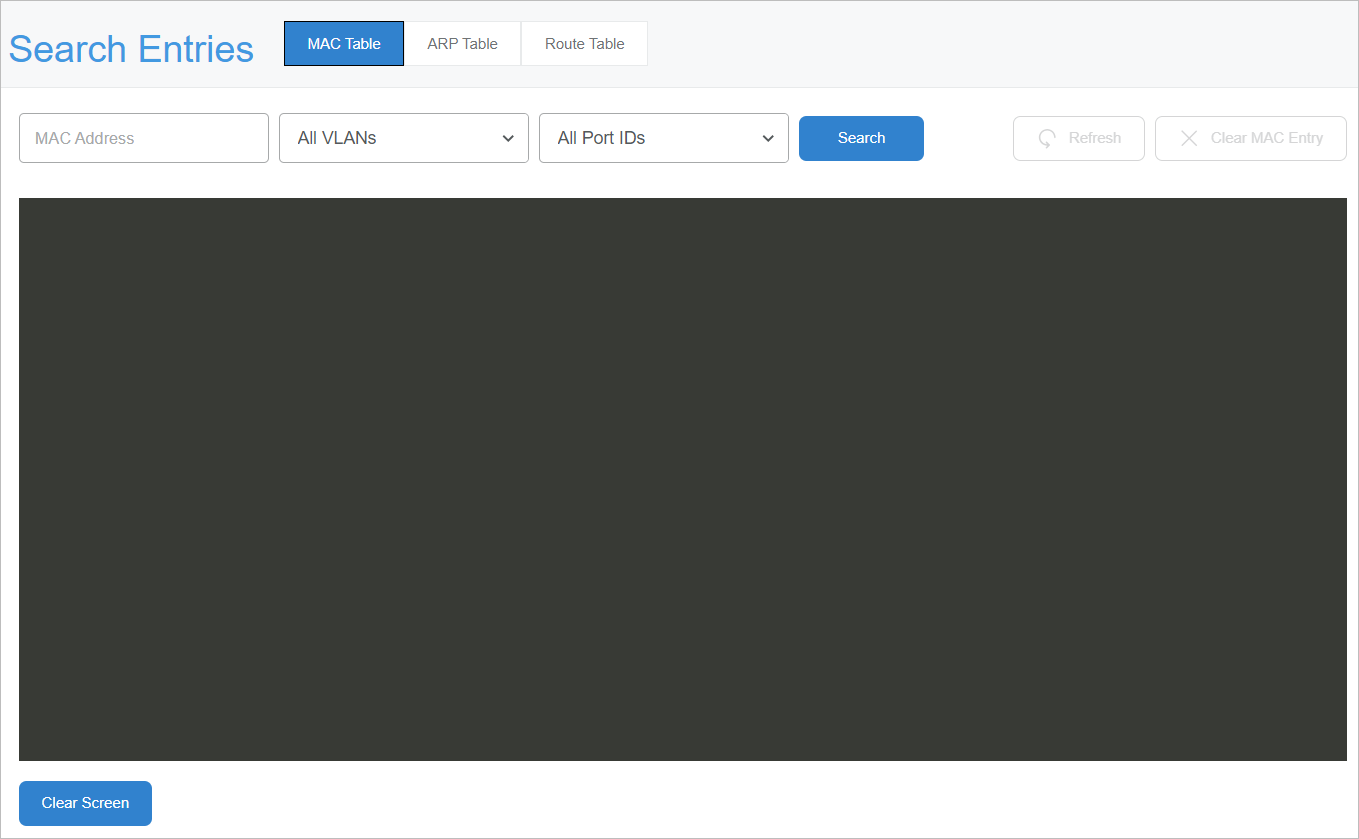
To explore the entries in a table, click the Search Entries button. In the Search Entries window, enter your search term (such as MAC address, IP address, prefix, or port ID, depending on the selected table). Apply optional filters. Use the tabs at the top to explore other tables.
This example shows the Search Entries window for the MAC table.
Switch Charts
Explore various charts to gain insights into switch events and health status.
At the top of this section, select All Ports or a specific port.
In each chart, hover your mouse pointer over any data point to see the details.
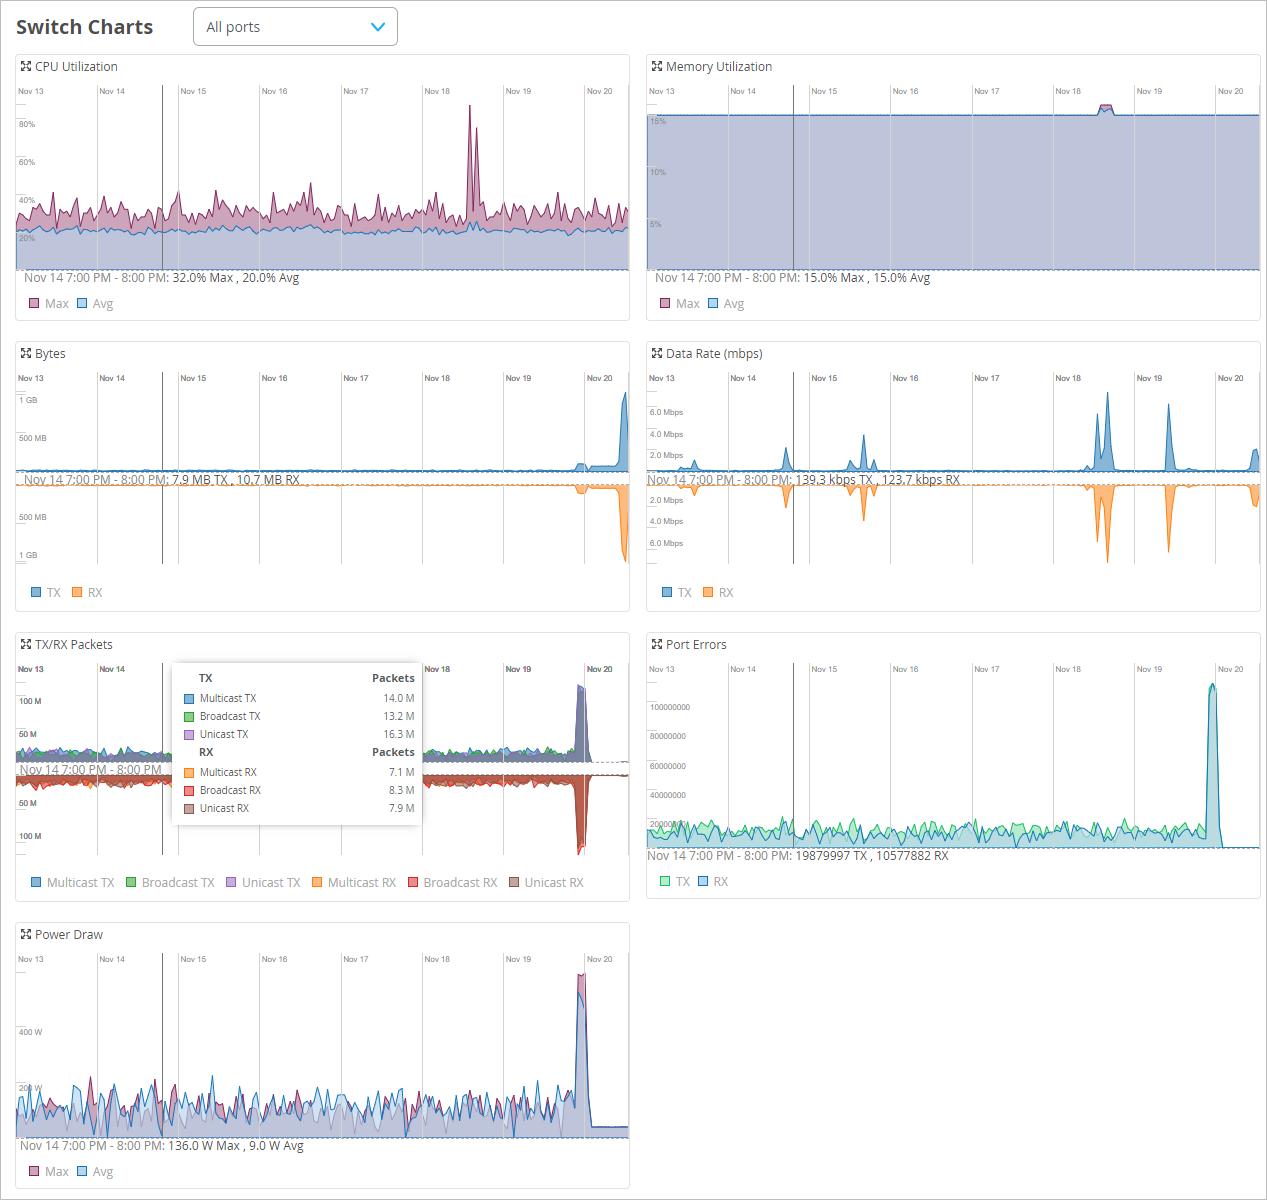
The charts include:
-
CPU Utilization
-
Memory Utilization
-
Bytes
-
Data Rate
-
TX/RX Packets
-
Port Errors
-
Power Draw
Current Values for Switches
The Current Values section appears toward the bottom of the Insights page.
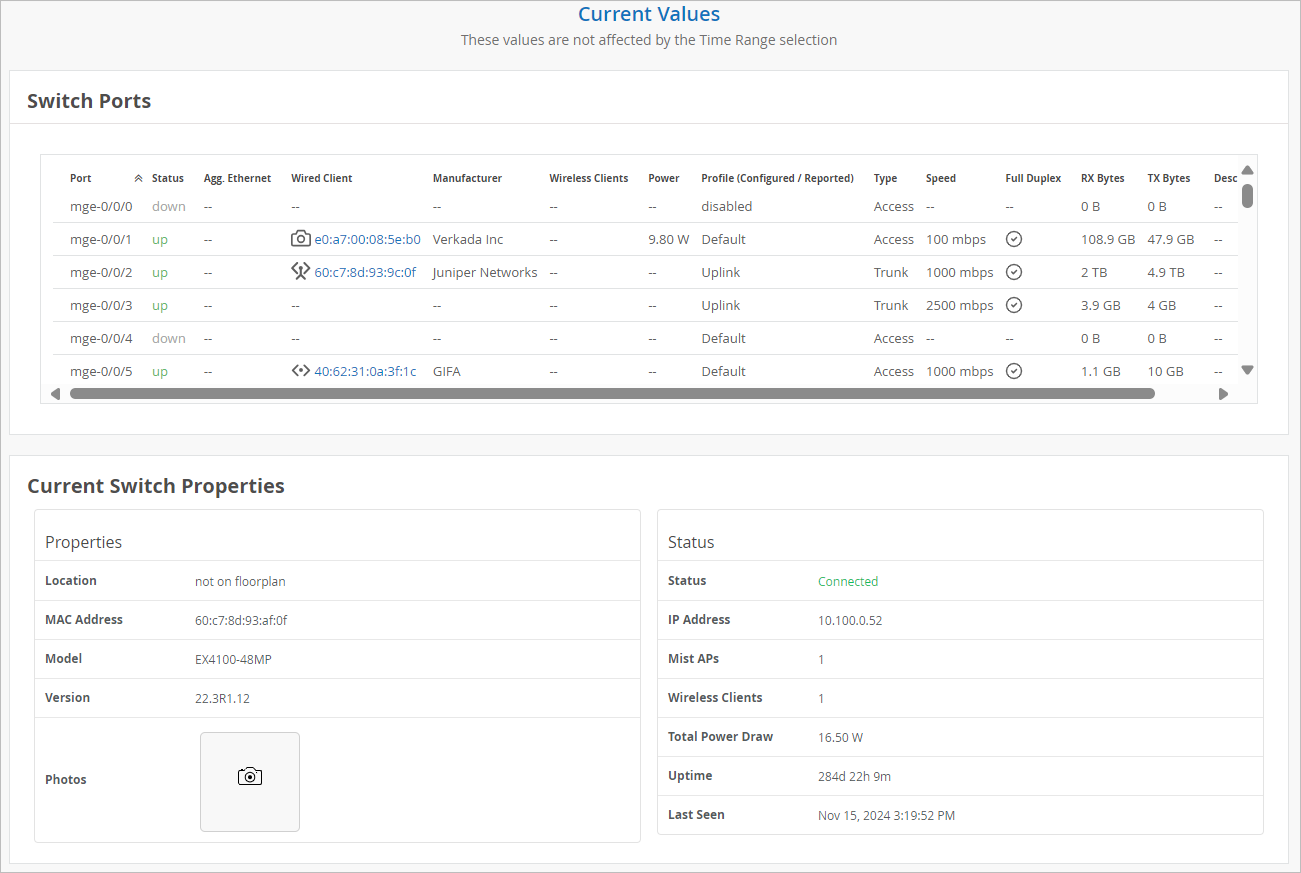
The values in this section don't change when you adjust the time range selection at the top of the page.
When you select a switch as the context, the Current Values section includes:
-
Switch Ports—Details such as status (down or up), manufacturer, client, power, profile, type, speed, and RX/TX bytes. Click a client name to reload the Insights page showing only the data for that client.
-
Current Switch Properties
-
Properties—Location, MAC address, model, and firmware version
-
Status—Current status, IP address, number of APs and clients, power draw, and uptime
-