Managing Transport Domain Data Display Options
Layers, types, transport circuits, transport SRLGs, and latency values can all be displayed in the web UI and the NorthStar Planner. The REST API offers the option to use protected links. This topic focuses on navigating to the display options you have in each case.
Latency information is not available from proNX Optical Director.
Displaying Layers
Displaying Layers in the Web UI
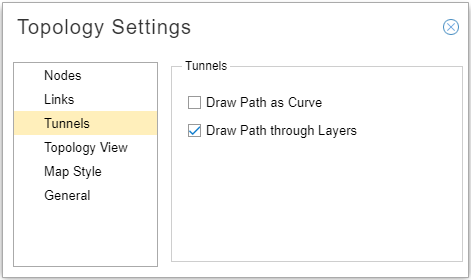
Important: To view transport layers in the web UI topology map, you must enable the function using the topology settings window. On the topology menu bar in the upper right corner of the topology map view, click the settings icon to open the Topology Settings window. Click Tunnels on the left and click the check box for Draw Path through Layers. See Figure 1.
In the left pane of the topology window, select Layers from the drop-down menu to display the Layers list. The Layers list gives you the option to exclude or include individual layer information in the topology map.
The colors indicated in the Layers list are reflected in the topology map so you can distinguish the nodes belonging to the different layers. Figure 2 shows an example of a topology map that includes both IP Layer and Transport Layer elements. The dotted link lines are interlayer links.

Displaying Layers in the NorthStar Planner
In the left pane of the topology map window, access advanced filters by selecting Filters>Advanced.
From the Advanced filters window you have the option to hide various elements on the topology map including IP layer, transport layer, and interlayer links. To hide an element, select the corresponding check box. To display an element, clear the corresponding check box.
Displaying Node and Link Types
Displaying Types in the Web UI
In the left pane of the Topology window, select Types from the drop-down menu to display the Types list. The list includes categories of nodes and links found in the network. Different types are associated with different icons, which are reflected in the topology map.
You can select or deselect a type by checking or clearing the corresponding check box. Only selected options are displayed in the topology map. Figure 3 shows a Types list and topology map for a network that includes a Coriant transport layer.
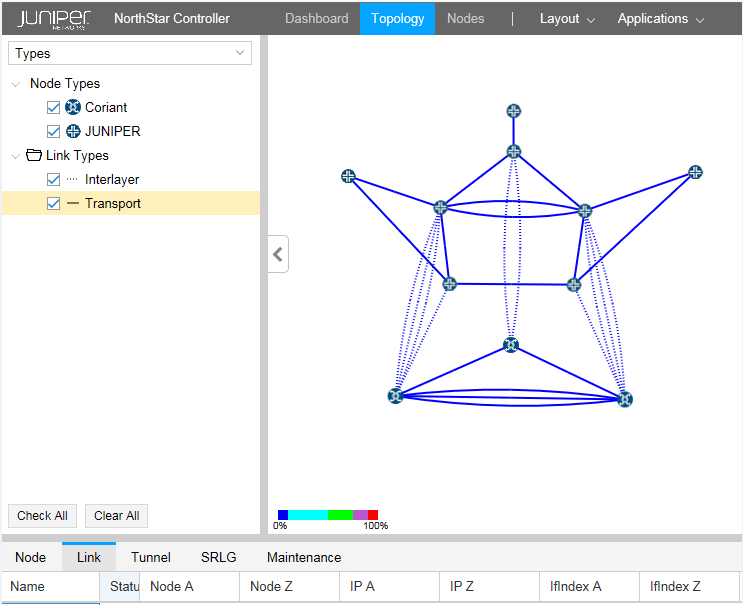
The network information table below the topology map includes a Layer column that is available on the Node tab. If you do not see the column, hover over any column heading and click the down arrow that appears. A column selection window is displayed. Select the Layer check box to include that column in the table.
Displaying Types in the NorthStar Planner
In the Left pane of the Topology Map window, select Filters>Types to display categories of nodes and links that you can opt to display or hide on the topology map.
You can select or deselect a type (Transport, for example) by checking or clearing the corresponding check box. Only selected options are displayed in the topology map. You can also change the line color and style for a link type by clicking the line indicator next to the check box.
The Network Info table below the topology map includes tabs for L1 Links, L1 Nodes, and Interlayer Links.
If you do not see a column, click the plus sign (+) at the end of the row of column headings to display available columns. Click the column you want to display.
Displaying Transport Circuits and Associated IP Links
Once the interlayer links are mapped, the transport paths for the corresponding IP links are known and are displayed in the UI.
Displaying Transport Circuits in the Web UI
In the web UI, the paths are added to the network information table in the Tunnel tab. In the Layer column, they are identified as Transport. The names are the same as the corresponding IP link names.
If a selected IP link in the Link tab of the network information table has an associated transport circuit, it is automatically highlighted.
Displaying Transport Circuits in the NorthStar Planner
In the NorthStar Planner, the paths are added to the network information table in the Tunnels tab together with normal packet tunnels. The names are the same as the corresponding IP link names. In the Type column, they are identified as L1Circuit.
Right-click an IP link in the Network Info table Tunnels tab or on the topology map to access the option to display the L1 circuit path if there is an associated transport circuit.
Displaying Latency
Displaying Latency in the Web UI
Latency information is not available from proNX Optical Director.
Using the topology settings window, you can opt to display latency on the topology map. Perform the following steps:
Access the Topology Settings window by clicking on the settings icon (gear) in the upper right corner of the topology window. Figure 4 shows the settings icon.
Figure 4: Settings Icon to Access Topology Settings
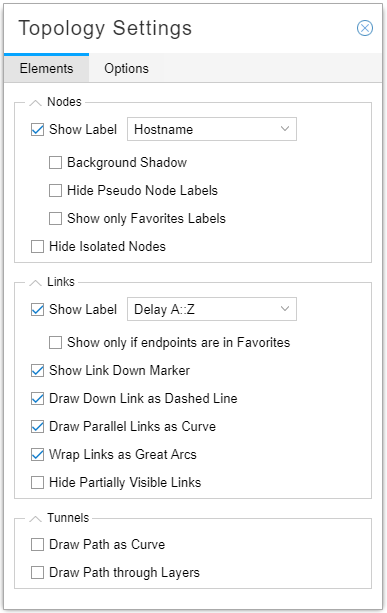
In the Elements tab, shown in Figure 5, click the check box for Show Label in the Links section (the middle section) and select Delay A::Z from the corresponding drop-down menu.
Figure 5: Link Label Settings
The topology map displays the latency values for each link in the form delayA::delayZ (252::252, for example), in milliseconds. In the Link tab of the network information table, the Delay A and Delay Z columns also display these latency values.
Displaying Latency in the NorthStar Planner
Through the Link Labels window, you can opt to display latency on the topology map. Perform the following steps:
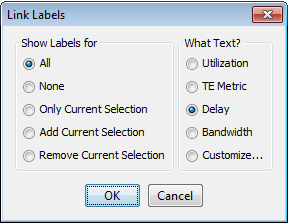
Right-click in the topology map window and navigate to Labels>Link Labels. The Link Labels window is displayed as shown in Figure 6.
Figure 6: Link Labels WindowIn the “What Text?” column, select Delay and click OK.
The topology map displays the latency values for each link in the form delayA-delayZ (252-252, for example).
Displaying Transport SRLGs
Displaying SRLG information is the same in both the web UI and the Nework Planner. Click the SRLG tab in the network information table to display all SRLGs, including transport SRLGs. Transport SRLGs have names beginning with TSRLG by default. For example, TSRLG_4. If you configured an optional prefix extension in the transport controller profile (to help prevent range overlap), that is also displayed in the Name column. For example, TSRLG_Coriant_4.
When you select an SRLG, all links in all layers in the group are highlighted in the topology map.
In the web UI, you can also use the Link Label settings window shown in Figure 5 to specify that SRLGs are to be displayed on the topology map as link labels.
Displaying Link Protection Status
- Displaying Link Protection Status in the web UI
- Displaying Link Protection Status in the NorthStar Planner
Displaying Link Protection Status in the web UI
In the network information table, you can display a column that shows the protection status of transport and IP layer links. Perform the following steps:
Select the Link tab in the network information table.
Click the down arrow in any column heading, and select Columns.
Click the checkbox beside Protected.
You can then manually change the protection status of any link by selecting the link and clicking Modify at the bottom of the table. Click in the Protected check box (Properties tab) to select or deselect protected status. Protected links are highlighted in the topology map.
Displaying Link Protection Status in the NorthStar Planner
In the NorthStar Planner network information table, you can view the protection status of transport as well as IP layer links. Perform the following steps:
In the network information table, select the Links or L1Links tab.
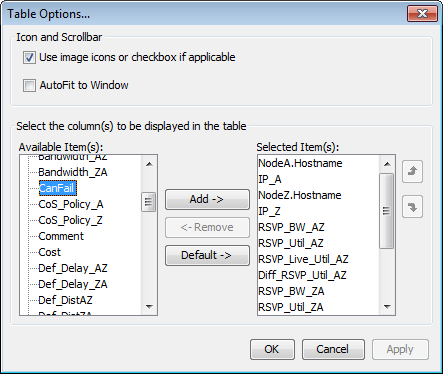
Right-click in any column heading and select Table Options to display the Table Options window shown in Figure 7.
Figure 7: Table Options WindowOn the left side, select CanFail and click Add to add the column to the display.
By default, links are set to CanFail=yes, and the corresponding check boxes are selected. If the transport controller indicates that a link is protected, NorthStar clears the check box for that link, making it protected.
The NorthStar REST API offers the ability to use a protected link, which suspends the link’s protected status.

