Netflow Collector
Netflow Collector is a network planning and reporting tool in NorthStar Controller. It provides a way to gather and generate reports on detailed network traffic information. NorthStar leverages the Junos OS implementation of flow monitoring and aggregation using Netflow Version 9 and Version 10 (IPFIX) flow templates. See the following Junos OS documentation for background:
Configuring Flow Aggregation to Use Version 9 Flow Templates
Configuring Flow Aggregation to Use IPFIX Flow Templates on MX, vMX and T Series Routers, EX Series Switches and NFX250
Configuring Flow Aggregation to Use IPFIX Flow Templates on PTX Series Routers
The Junos OS on the routers samples the traffic, builds a flow table, and sends the details of the flow table to NorthStar periodically.
NorthStar (Netflow daemon), receives the data from the routers, decodes the records, performs additional aggregation of the data and creates the demands, stores the data in the NorthStar database, and shares the information with the PCS. The data is then available for report creation in the NorthStar Controller and for report creation, planning, and modeling in the NorthStar Planner.
NorthStar monitors AS and VPN traffic, and supports both IPv4 and IPv6.
NorthStar Netflow Collector requires:
Configuration on the routers in the network.
Initial and periodic device collection to create and maintain an accurate VPN model in NorthStar. We recommend you execute device collection at least daily.
You can optionally customize Netflow Collector settings in the /opt/northstar/data/northstar/cfg file on the NorthStar application server.
The following sections describe using Netflow Collector in the NorthStar Controller:
Configuration for Netflow Collector
Configuration on the Network Routers
Netflow Collector on the NorthStar Controller requires that the network routers be configured for flow monitoring (Netflow v9 or v10) according to the router operating system documentation.
At present, Juniper devices and Cisco IOS-XR devices are supported, with both Netflow v9 and v10.
Some important considerations:
The source address (inline-jflow statement) identifies to the netflow daemon (netflowd) the device that is reporting the flow. It should be configured as the router’s loopback address.
The flow-active-timeout value has a default of 60 seconds. We recommend keeping it at 60 seconds or less.
This is a Junos OS example showing Netflow v9 configuration statements:
At the interfaces hierarchy level:
interfaces {
   ge-0/0/1  {
        unit 0 {
            family inet {
                sampling {
                    input;
                }
                address 10.0.21.1/24;
            }
        }
    }
}
At the forwarding-options hierarchy level:
forwarding-options {
  sampling {
      nfv9-ipv4 {
          input {
              rate 1;
              run-length 0;
          }
          family inet {
              output {
                  flow-inactive-timeout 15;
                  flow-active-timeout 60;
                  flow-server 172.16.18.1 {
                      port 9000;
                      version9 {
                          template {
                              nfv9-ipv4;
                          }
                       }
                   }
                   inline-jflow {
                       source-address 10.1.0.104;
                   }
              }
          }
      }
At the chassis hierarchy level:
chassis {
    network-services enhanced-ip;
    fpc 0 {
        sampling-instance nfv9-ipv4;
    }
}
At the services hierarchy level:
services {
    flow-monitoring {
       version9 {
           template nfv9-ipv4 {
               nexthop-learning {
                   enable;
               }
               template-refresh-rate seconds 60;
               option-refresh-rate seconds 60;
               ipv4-template;
           }
       }
    }
}
This is a Junos OS example showing Netflow v10 configuration statements:
At the interfaces hierarchy level:
interfaces {
   ge-0/0/1  {
        unit 0 {
            family inet {
                sampling {
                    input;
                }
                address 10.0.21.1/24;
            }
        }
    }
}
At the forwarding-options hierarchy level:
forwarding-options {
  sampling {
      instance {
        nfv10-ipv4 {
            input {
                rate 1;
                run-length 0;
            }
            family inet {
                output {
                    flow-inactive-timeout 15;
                    flow-active-timeout 60;
                    flow-server 172.16.18.1 {
                        port 9000;
                        version-ipfix {
                            template {
                                nfv10-ipv4;
                            }
                        }
                    }
                    inline-jflow {
                        source-address 10.1.0.104;
                    }
                }
            }
        }
      }
  }
}
At the chassis hierarchy level:
chassis {
    network-services enhanced-ip;
    fpc 0 {
        sampling-instance nfv10-ipv4;
    }
}
At the services hierarchy level:
services {
    flow-monitoring {
       version-ipfix {
           template nfv10-ipv4 {
               nexthop-learning {
                   enable;
               }
               template-refresh-rate {
                   seconds 60;
               }
               option-refresh-rate {
                   seconds 60;
               }
               ipv4-template;
           }
       }
    }
}
Configuration on the NorthStar Application Server
Netflow Collector is installed as part of the Analytics package with NorthStar Controller. See Installing Data Collectors for Analytics in the NorthStar Controller Getting Started Guide.
Sampling is configured on the ingress interface. Flows enter the ingress PE which sends netflow records to netflowd. The netflow records include the information that determines the flow’s destination, or “prefix”.
On the NorthStar server where you installed the NorthStar analytics package, there are some settings in the /opt/northstar/data/northstar.cfg file that can be customized for Netflow, all of which begin with “netflow_”, as described in Table 1.
See Platform and Software Compatibility in the NorthStar Controller Getting Started Guide for information on supported deployment configurations. The analytics package might or might not be installed on the same server as the NorthStar application, depending on your deployment configuration.
Setting |
Notes |
|---|---|
netflow_collector_address |
The IP address of the server on which the NorthStar analytics package was installed (which might or might not be the same server on which the NorthStar application was installed). |
netflow_port |
Default Netflow port is 9000. |
netflow_ssl |
SSL disabled (default) = 0 SSL enabled = 1 |
netflow_log_level |
The level of information that is captured in the log file at /opt/northstar/logs/netflowd.msg. The default level is “info”. If more information is required, you can set the level to “debug”, and the log will include all the flows received from each device, identified by source IP address. You can also see, for each flow, all the fields that netflowd processes and parses. |
netflow_sampling_interval |
The default SAMPLING-INTERVAL, if the router does not provide the SAMPLING-INTERVAL in the Template FlowSet. Note:
If you are using Netflow v10 (IPFIX) in the network, you must manually configure netflow_sampling_interval in /opt/northstar/data/northstar.cfg. NorthStar does not support automatic extraction of the IPFIX sampling interval. |
netflow_publish_interval |
Publishing interval to both Elasticsearch and the PCS. Traffic is aggregated per publishing interval. The default interval is 60 seconds. This value must be equal to or greater than the reporting time configured in the router (flow-active-timeout value) to ensure that for every publishing interval, all active flows are reported. |
netflow_workers |
See Secondary Collector Installation for Distributed Data Collection in the NorthStar Controller Getting Started Guide for more information about workers. |
netflow_ageout |
Enabled = 1, Disabled = 0 If enabled, netflowd sends one final update after a flow is no longer active, reporting the bandwidth as 0. If disabled, the bandwidth value is not reported once a flow has become inactive, so the last reported active value is the last value displayed. |
netflow_aggregate_by_prefix |
Possible values are:
|
netflow_stats_interval |
Interval at which statistics are printed to the log file. The default is -1 (never). |
netflow_as_demands |
Netflowd does not generate AS demands by default. Unless you specify otherwise, AS demands do not appear through the REST API or through Demand Reports in the UI, even if valid netflow records are being exported. Possible values for this setting are:
If the setting is missing from the northstar.cfg file altogether, AS demand generation is disabled. |
If you make changes to these settings, you must restart the netflowd process for the changes to take effect.
Viewing Demands in the Web UI
The Demand tab in the network information table shows aggregated demands based on the flow monitoring of the Netflow Collector. Four aggregation keys are used:
Ingress PE (device reporting the flow)
BGP next hop IP address
Routing Table Name
When the key is present, it is the VRF name for which the ingress interface is configured.
This key is absent if there is no VPN associated with the demand. In this case, the ingress interface is configured in the default routing table.
This key displays as “NONE” if netflowd is not able to determine whether the ingress interface is configured on the default routing table or on a VRF. That would happen, for example, if NorthStar was not able to collect the snmp-indexes for the interfaces.
Specification of IPv4 (shown as IP) or IPv6
The values of the keys are reflected in the names of the demands in the table. Some examples:
vmx102_10.1.0.10/32_vpn100_IP
vmx102_10.1.0.10/32_IP (no VPN associated with the demand)
vmx102_10.1.0.10/32_NONE_IP (unknown whether the ingress interface is configured on the default routing table or on a VRF)
Selecting a demand in the table highlights the corresponding routing path in the topology map.
Currently, the ability to preview the path on the topology map is limited to RSVP-based LSPs (not segment routing). A future release will enhance this feature.
From the network information table, you can delete demands, but you cannot add or modify them. Demands are never automatically deleted.
To view demand data in the network information table:
The Demand tab is not displayed by default. Click the plus (+) sign in the network information table header and select Demand from the drop-down menu as shown in Figure 1.
Figure 1: Adding the Demand Tab to the Network Information Table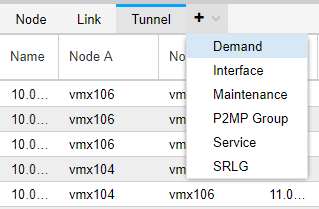
Figure 2 shows an example of the Demand tab data.
Figure 2: Network Information Table, Demand Tab
For each demand, the Demand tab lists the demand properties. Whether the demand is associated with a VPN or not is shown in the Owner field. If there is no VPN associated with the demand, the Owner field is blank. The Most Recent Update column is updated at every publishing interval. If it is not updated, the flow is no longer active.
Right-click a demand in the table and select View Demand Traffic. This opens a new tab in the network information table, displaying a chart with demand traffic over time. You can adjust the time period in the upper left corner of the chart display, to show the past hour, day, seven days, or a custom time period.
The Service tab in the network information table displays information about VPNs in the network which might be associated with some of the flows. The Service tab is not displayed by default. Click the plus sign (+) on the network information table header and select Service to open the Service tab. The table includes one row per VPN. Figure 3 shows an example of the Service tab data.
Figure 3: Network Information Table, Service Tab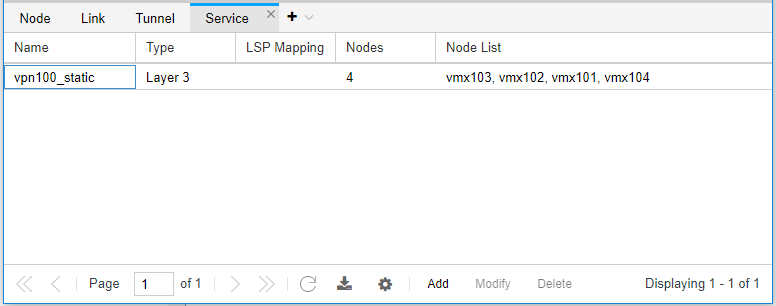
The Nodes column indicates how many PE routers are associated with the VPN, and the Node List column lists them. You can right-click on a VPN row to and select Show Detail to see information about each interface on each node. From the detail window, you can right-click on an interface and select Show Demand Traffic to see the demand traffic chart for the specific interface. You can adjust the time period in the upper left corner of the chart display, to show the past hour, day, seven days, or a custom time period.
You can also Show Demand Traffic at the VPN level in the Service by right-clicking the VPN row. The resulting chart displays the total traffic for the VPN.
Right-click a VPN on the Service tab and select Enable Animated Selection to see an animated VPN service view in the topology map window. This provides a view of the network in the context of the VPNs, indicating which parts of the network the VPNs service. To leave the animated view and return the topology map to the original layout, right-click again on the VPN and select Disable Animated Selection.
You can create a Demand Aging task in the Task Scheduler (Administration > Task Scheduler) to regularly remove inactive demands from the UI.
When a flow is no longer observed, the demand is retained in the NorthStar UI (Demands tab in the network information table) until you delete it. You can do this manually or you can create a Demand Aging task to automate the process. This task removes demands that are no longer active, according to the maximum age you specify.
For example, if you create a Demand Aging task with a maximum age of ten minutes, the task deletes all demands that have been inactive for ten minutes or more.
To create a Demand Aging task, Click Add in the Task Scheduler. Enter a name for the task and select Demand Aging from the drop-down menu in the Task Type field. Click Next to proceed to the maximum age window.
To specify the maximum age:
Enter an integer in the Max Age field.
Use the drop-down menu in the Units field to select seconds, minutes, hours, or days.
Click Next to proceed to the scheduling window. Like many other task types, you can schedule this task to recur automatically on a regular basis.
For more information about the Task Scheduler, see Introduction to the Task Scheduler.
Demand Reports Collection
Demand reports are generated when you run a Demand Reports collection task from Administration > Task Scheduler.
Click Add to begin creating a new task.Figure 4 shows the Create New Task window. Give the new task a name in the Name field. Use the Task Type drop-down menu to select Demand Reports.
Figure 4: Create New Task Window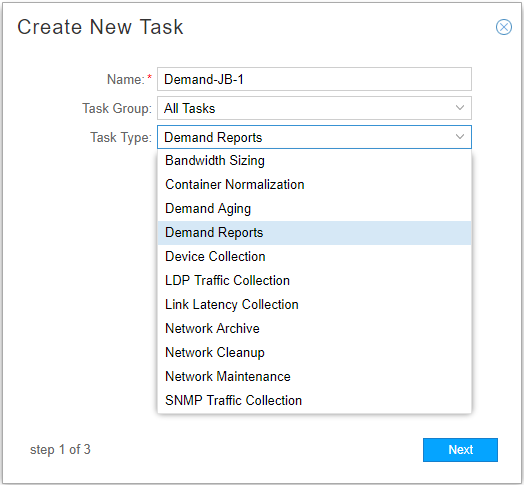
Click Next to proceed to the Report Types and Options window.
The report types are shown in Figure 6. In the Report Types tab, select which reports you want to generate. If you select Include AS Demands, you have the additional option of choosing from a number of AS reports.
Note:AS demands must be enabled in the northstar.cfg file as explained in Configuration on the NorthStar Application Server.
Figure 5: Report Types Tab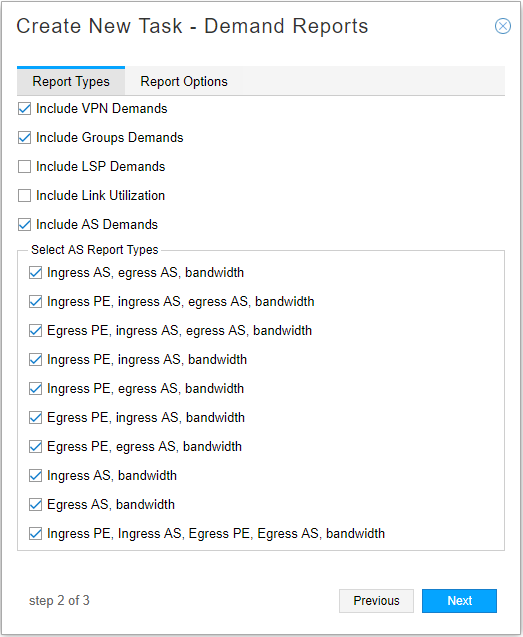
Click the Report Options tab.
Figure 6 shows the Report Options tab.
Figure 6: Report Options Tab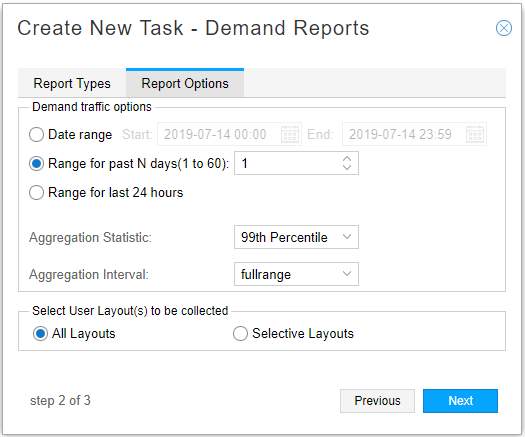
In this window, you can select the reporting period:
Date range including hours and minutes (seven day maximum)
Range for past N days (up to 60 days)
Range for the last 24 hours (gives you data for the last 24 hours)
If you want a report that includes data for specific hours, you would select the date range option, and specify the hours you want included as shown in Figure 7.
Figure 7: Date Range Option with Hours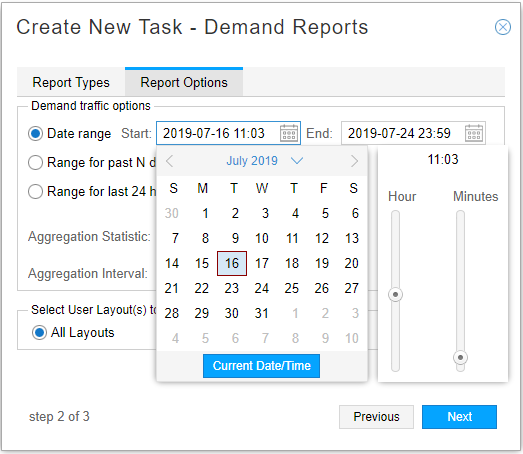
The traffic is loaded as demand with a configurable number of statistical periods. The options in the Aggregation Statistic drop-down menu are described in Table 2.
Table 2: Aggregation Statistics Options Aggregation Statistic
Description
Average
For each interval, the samples within that interval are averaged. If there are N samples for a particular interval, the result is the sum of the all the sample values divided by N.
Max
For each interval, the maximum of the sample values within that interval is used.
Min
For each interval, the minimum of the sample values within that interval is used.
80th, 90th, 95th, 99th Percentile (X percentile)
For each interval, the X percentile value of the samples within that interval is used. The X percentile is computed from an equation that takes into consideration the average for the interval and the standard deviation. The result is that X percent of the sample values lie at or below the calculated value.
The Aggregation Interval options are described in Table 3.
Table 3: Aggregation Interval Options Aggregation Statistic
Description
fullrange
The whole range is one interval. Produces one aggregated data point for the entire range.
daily
Each day is one interval. Produces one aggregated data point per day.
hourly
Each hour is one interval. Produces one aggregated data point per hour.
Also in this window, you have the opportunity to specify that you want to group data in the reports according to the groups captured in your saved topology layouts. You can select all layouts or specific ones. If you select more than one layout, reports are generated for each.
Figure 8 shows the Create New Task – Demand Reports window in which two saved layouts are selected for data grouping.
Figure 8: Demand Reports Task, Select Saved Layouts for Grouping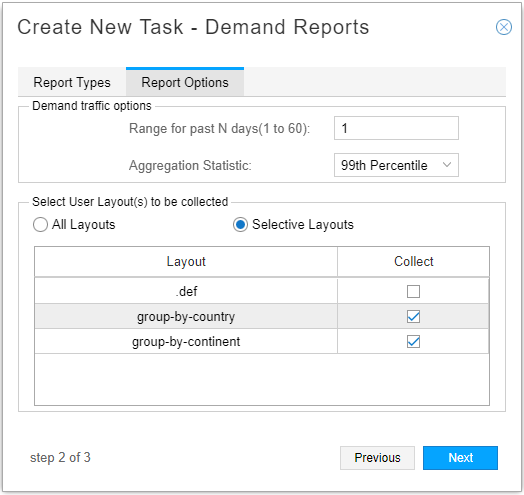
See Group and Ungroup Selected Nodes for information about creating groups and using the auto-group function, and Manage Layouts for information about saving layouts.
Click Next to proceed to the scheduling parameters.
The Create New Task - Schedule window is displayed as shown in Figure 9. You can opt to run the collection only once, or to repeat it at configurable intervals.
Figure 9: Device Collection Task, Scheduling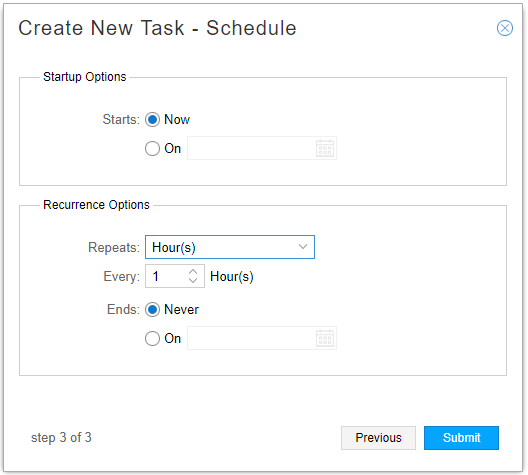
Click Submit to complete the addition of the new collection task and add it to the Task List. Click a completed task in the list to display the results in the lower portion of the window. There are three tabs in the results window: Summary, Status, and History. Figure 10 shows an example of the Status tab for a completed Demand Reports collection task. The status notes indicate the locations of the reports that were generated.
Figure 10: Demand Reports Collection Results, Status Tab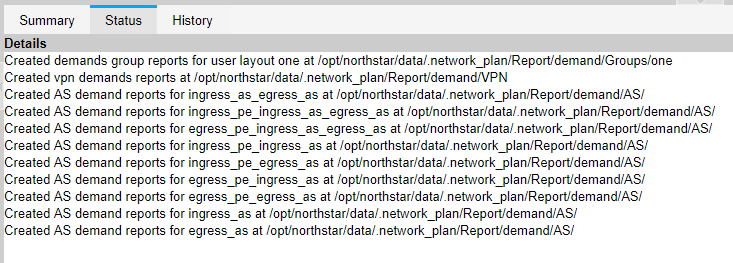
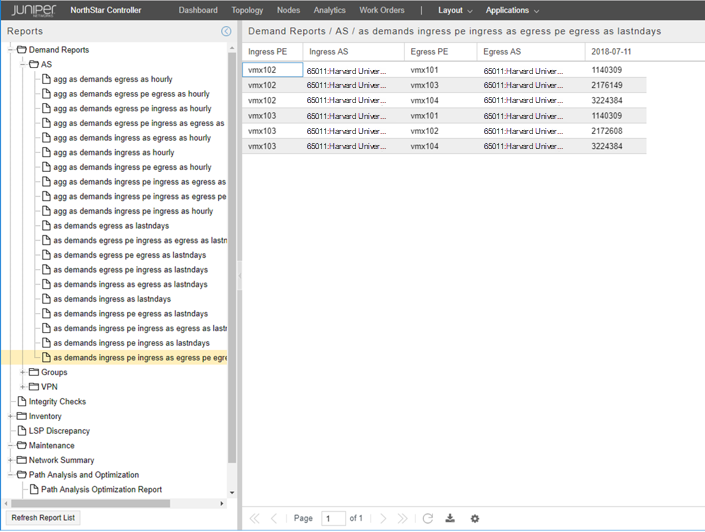
The reports are also available by navigating to Applications > Reports. An example list of reports is shown in Figure 11.
Figure 11: Example List of Demand Reports