Reports Overview
Navigate to Applications > Reports to access the reports described in Table 1.
Click the Help icon (question mark) in the upper right corner of the NorthStar window to display more information about the selected report.
Report |
Source |
|---|---|
Demand Reports |
Generated when you run a Demand Reports Collection task. You select the specific reports you want to generate when you schedule the collection task. |
Integrity Checks |
Generated when you run the Device Collection task and select configuration data as a collection option. Note:
You must run a collection to generate a network archive for this report to be available. |
Inventory |
Generated when you run the Device Collection task and select equipment CLI data as a collection option. Note:
You must run a collection to generate a network archive for this report to be available. |
LSP Discrepancy |
During an HA switchover, the PCS server performs LSP reconciliation and produces the LSP discrepancy report. This report identifies LSPs that the PCS server has discovered might require re-provisioning. |
Maintenance |
Generated when you use the Simulate Maintenance Event function. |
Network Summary |
Updated summary of network elements. One report is currently available in this category, called Nodes. It displays counts of LSPs that start, end, or transit through each node in the topology. |
Path Analysis and Optimization |
Generated when you use the Analyze Now function for path optimization. Note:
PCC-controlled LSPs are not included in the reports because NorthStar does not attempt to optimize PCC-Controlled LSPs.
|
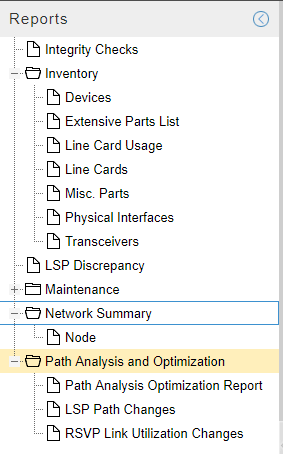
Figure 1 shows the Reports menu.
Report details are displayed in a pane to the right of the menu when you click an individual report in the menu. Click the Help icon (question mark) in the upper right corner of the report details pane to display a description of the report. Click the header row of any column to sort the table by that column (toggle for ascending/descending sort order). Additional filtering and sorting options, and column selection are available by clicking the down arrow that appears in the header row of any column when you mouse over the header.
Right-click a row in a report for additional options relevant to that report. For example, in a Network Summary Node report, you can right-click and select one of several options that return you to the topology view with the selected filtering applied to the network information table and to the topology map. You can right-click a row in a Demand report and select Show Trends to pop up a new window showing the trend over time for that demand. In the Integrity Check report, you can right-click a row and select Show Config to bring up the Configuration Viewer.
At the bottom of the Reports window, click the export icon to export the report to a CSV file.