Interactive Map Features
The topology map is interactive, meaning that you can use features within the map itself to customize the map and the network information table. The map uses a geographic coordinate reference system. Some features enabled by that system include:
Constrained zooming: NorthStar Controller performs coordinate checking so the view is constrained to the coordinates of the earth.
World wrapping/map wrapping: Scrolling the map in one direction is like spinning a globe. This enables representation of links across an ocean, for example.
The following sections describe additional map features and functionality:
Right-Click Functions
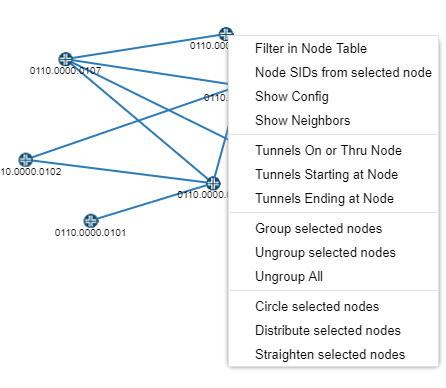
Right-click a node, selected nodes, or node group on the topology map to execute node-specific filtering as shown in Figure 1 and described in Table 1.
Option |
Function |
|---|---|
Filter in Node Table |
Filters the nodes displayed in the network information table to display only the selected node(s) or node group(s). |
Node SIDs from selected node |
Labels the nodes in the topology with the node SIDs from the perspective of the node on which you right-clicked. |
Show Config |
Opens the Configuration Viewer, displaying the configuration of the node on which you right-clicked. See Configuration Viewer for prerequisites for the configuration to be available. |
Show Neighbors |
Opens a new window displaying the neighbors of the node on which you right-clicked. |
Tunnels On or Thru Node |
Filters the tunnels displayed in the network information table to include only those that meet the On or Thru Node criteria. |
Tunnels Starting at Node |
Filters the tunnels displayed in the network information table to include only those that meet the Starting at Node criteria. |
Tunnels Ending at Node |
Filters the tunnels displayed in the network information table to include only those that meet the Ending at Node criteria. |
Group selected nodes |
Prompts you to give the group of nodes a name, after which the group can be expanded or collapsed on the topology map. This is a shortcut to the Layout > Group selected nodes function. |
Ungroup selected nodes |
Ungroups the nodes in the selected group. This is a shortcut to the Layout > Ungroup selected nodes function. |
Ungroup All |
Ungroups the nodes in all groups. This is a shortcut to the Layout > Ungroup All function. |
Circle selected nodes |
Arranges the selected nodes in a roughly circular pattern with the nodes and links separated as much as possible. This is a shortcut to the Layout > Circle selected nodes function. |
Distribute selected nodes |
Forces the selected elements away from each other and minimizes overlap. This is a shortcut to the Layout > Distribute selected nodes function. |
Straighten selected nodes |
Aligns the selected nodes in a linear pattern. This is a shortcut to the Layout > Straighten selected nodes function. |
Right-click a link on the topology map to execute link-specific filtering as shown in Figure 2 and described in Table 2.
Option |
Function |
|---|---|
Filter in Link Table |
Filters the tunnels displayed in the network information table to display only the selected link. |
Tunnels On or Thru Link |
Filters the tunnels displayed in the network information table to include only those that meet the On or Thru Link criteria. |
View Link Events |
Opens a new window in which you select the time range for the events you wish to view. Click Submit to open the Events window. |
View Interface Traffic |
Opens a new tab in the network information table at the bottom of the window, displaying the interface traffic. |
View Interface Delay |
Opens a new tab in the network information table at the bottom of the window, displaying interface delay over time. |
View Packet Loss |
Opens a new tab in the network information table at the bottom of the window, displaying packet loss statistics. |
To clear the tunnel filter so that all tunnels are again displayed, click a different tab (Node, for example), and then click the Tunnel tab again.
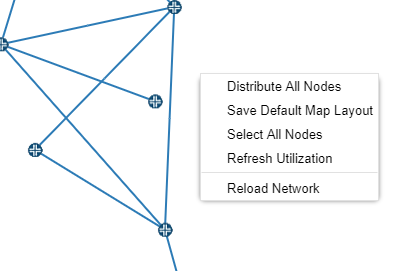
Right-click blank space in the topology map pane to access the whole-map functions shown in Figure 3 and described in Table 3.
Option |
Function |
Distribute All Nodes |
Distributes all the nodes in the map, pushing elements away from each other and minimizing overlap. This is a shortcut to selecting all nodes and navigating to Layout>Distribute selected nodes. |
Save Default Map Layout |
Saves the current layout as your default. The default layout is displayed when you first log in to NorthStar Controller. If you already have a default layout, this function overrides the existing default. You can also designate a default layout by navigating to Layout>Manage Layouts. |
Select All Nodes |
Selects all nodes on the topology map. This is a shortcut to using shift-left-click to create a selection box around all nodes or individually shift-clicking on all nodes. |
Refresh Utilization |
Refreshes the display of link colors based on RSVP utilization. Note:
Updates are periodically pushed to the client by the server. |
Reload Network |
Reloads the network to update the display. |
Topology Menu Bar
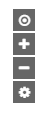
On the right side of the topology window is a menu bar offering various topology settings, as shown in Figure 4.
From the menu bar, you can:
Center the topology in the window (target icon).
Enlarge the topology in the window (plus symbol).
Reduce the size of the topology in the window (minus symbol).
Access the topology settings window (settings icon).
Topology Settings Window
Access the Topology Settings window by clicking on the settings icon (gear) in the upper right corner of the topology window. Figure 5 shows the settings icon.

The Topology Settings window contains many topology display settings, all in one place. Figure 6 shows the Topology Settings window with the two tabs that group related settings.
On the Elements tab, you can select as many settings as you like by clicking the associated check boxes. When you select to Show Label for nodes or links, you can select only one label from the corresponding drop-down menu.
NorthStar does not display node or link labels over a certain quantity, even if the Topology Settings call for labels to be displayed. This improves performance when redrawing a large number of graphic elements.
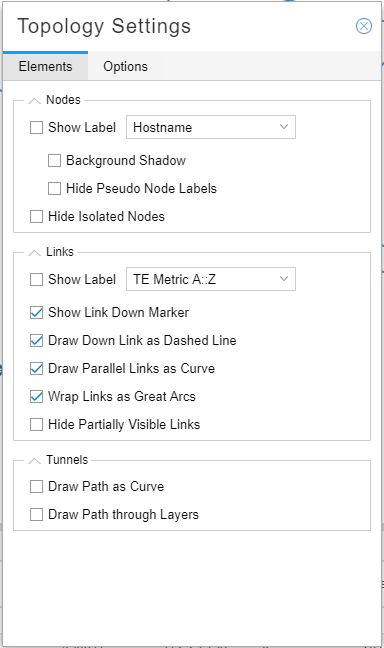
Drawing down links as a solid, rather than dashed, line can improve performance when redrawing the topology.
A few of these settings might not be self-explanatory:
Hide Partially Visible Links
Removes from the display any links for which both end nodes are not within the field of view. This is useful for focusing on a subset of a large network.
Wrap Links as Great Arcs
Distinguishes links that would have to wrap around the world map. An example is shown in Figure 7.
Figure 7: Wrap Links as Great Arcs Example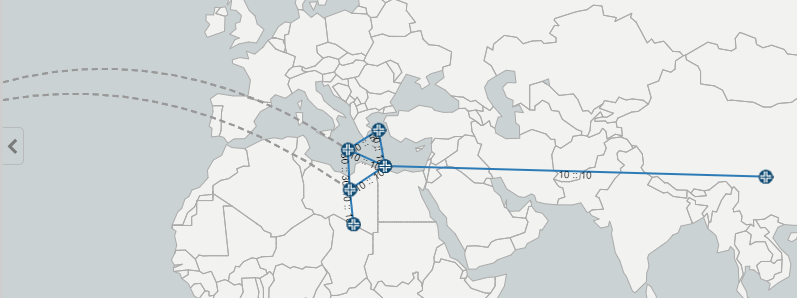
The Options tab offers a variety of topology display preferences, as shown in Figure 8.
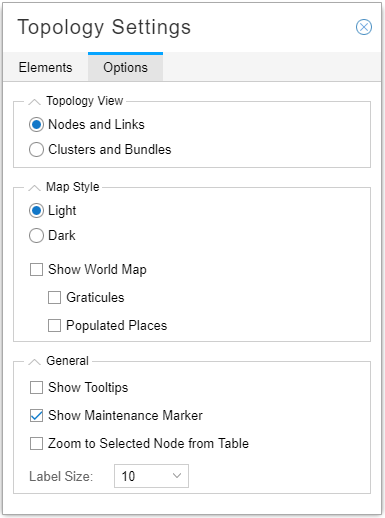
Topology View section
The two options available in this section are mutually exclusive; select one radio button or the other. Clusters and Bundles is useful where the display of a large number of nodes and links obscures visualization of the network as a whole. Clusters (of nodes) and bundles (of links) simplify visualization by representing groups of nodes that are close together as single, color-coded circles (clusters). Bundles (of links) are derived from the links between nodes and clusters. Figure 9 shows an example of how a portion of a large network looks when represented as clusters and bundles.
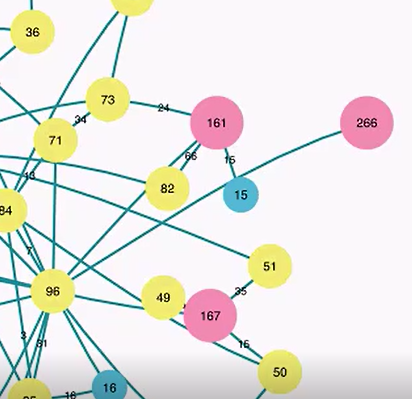
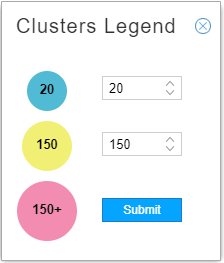
The number in each circle indicates the number of nodes in the cluster. The color coding of the clusters corresponds to the number of nodes in the cluster. You can customize the ranges by clicking on the color legend in the lower left corner of the map window as shown in Figure 10.
When you select Clusters and Bundles, node and link labels are not displayed.
Map Style section
The Light and Dark options available in this section are mutually exclusive; select one radio button or the other. Figure 11 shows an example of the light and dark map styles.
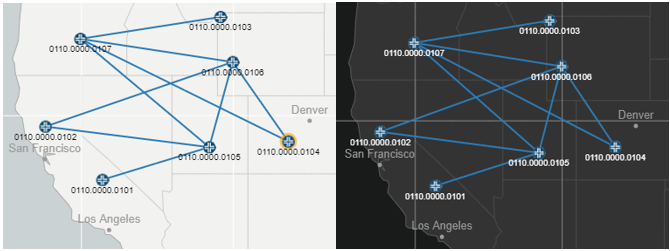
If you select to Show World Map, you can opt to display graticules (a grid of lines parallel to meridians of longitude and parallels of latitude) and labeling of major populated places (both shown in Figure 11).
Even if you deselect Show World Map, the topology still behaves according to geographical coordinates in terms of displaying the topology within the field of view.
General section
Select the check boxes for as many of the options in this group as you like:
Show Tooltips: Displays additional information about a node or link in the bottom right corner of the map pane when you mouse over a network element.
Show Maintenance Marker: Displays a red M over any link currently part of a maintenance event.
Zoom to Selected Node from Table: With this option enabled, when you click on a node entry in the network information table (Node tab), the topology automatically centers the view on that selected node.
Use the Label Size drop-down menu to select a font size for node and link labels.