Event View
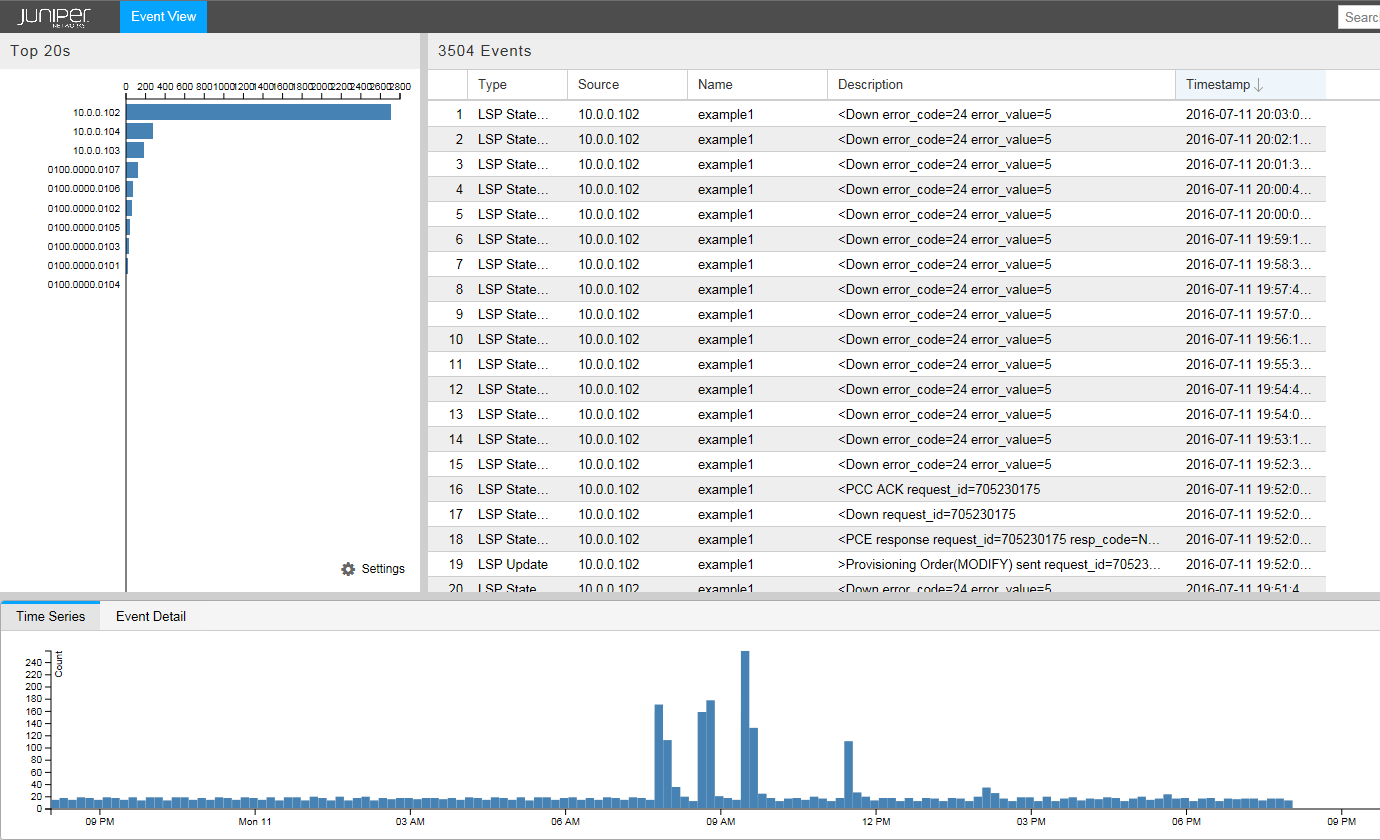
The Event View opens in a new browser window or tab when you navigate to Applications > Event View. Figure 1 shows the Event View.
The event data displayed in the Event View is stored in the database. The number of events depends on the NorthStar configuration. By default, NorthStar keeps event history for 35 days. To customize the number of days event data is retained:
Modify the dbCapacity parameter in
/opt/northstar/data/web_config.jsonRestart the pruneDB process using the
supervisorctl
restart infra:prunedb
command.
One event typically requires about 300 bytes of memory. See NorthStar Controller System Requirements in the NorthStar Controller Getting Started Guide for server sizing guidance.
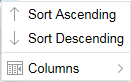
In the upper right pane of the view is a table of events, listed in chronologically descending order by default. You can change the order by using the sort options available when you hover over any column heading and click in the down arrow that is displayed. You can sort by any column, in ascending or descending order. You can also select the columns you want to display. Figure 2 shows the options displayed when you hover over a column heading and click the down arrow.
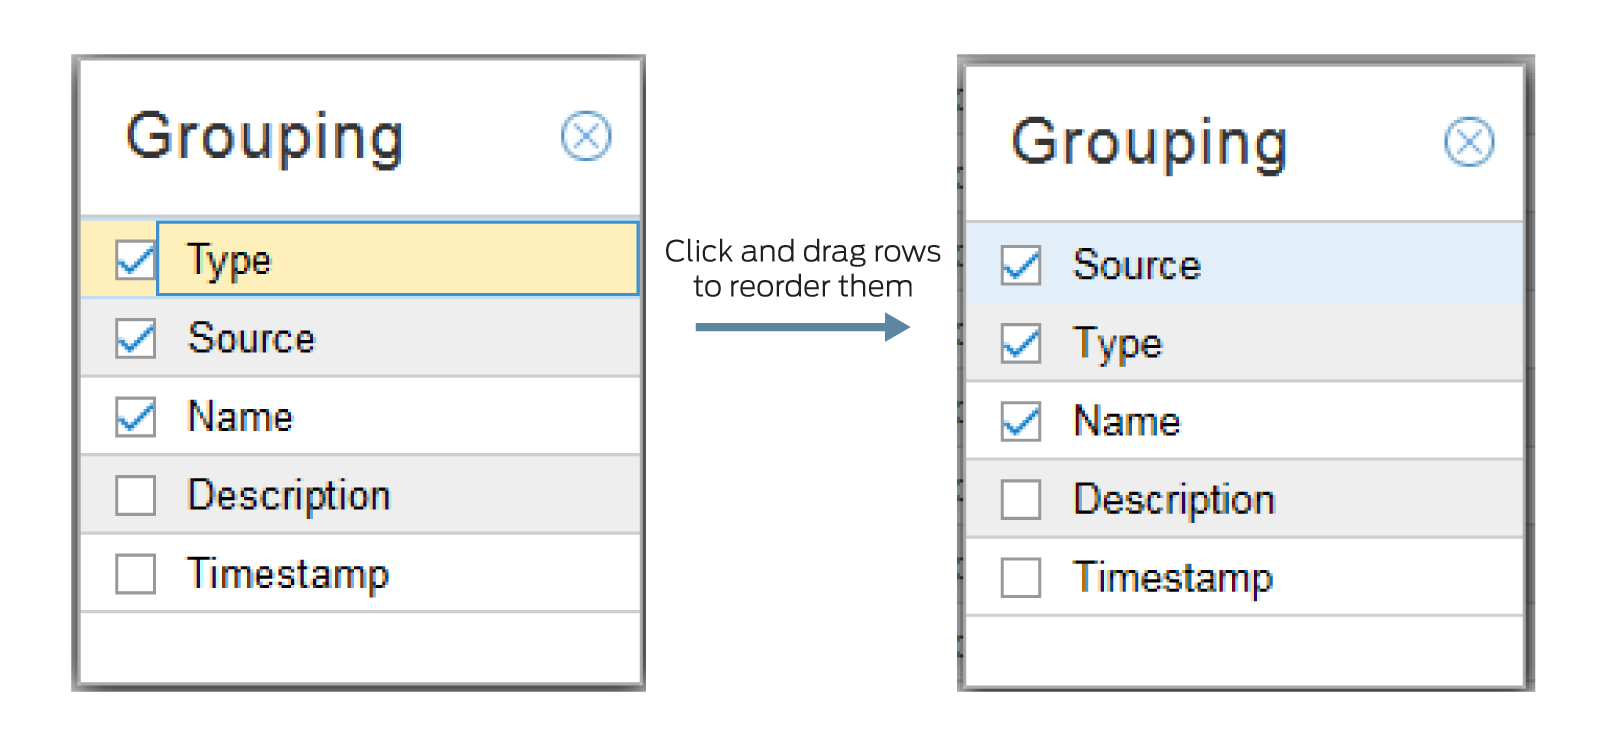
In the upper left pane is a grouping bar chart. By clicking on the Settings menu in the lower right corner of the pane, you can select the groupings you want to include. Click and drag groupings to reorder them as shown in Figure 3.
On the bar chart, any blue bar can be broken down further until you drill down to the lowest level, which is portrayed by a gray bar. Click a blue bar to drill down to the next level. To go back to a previous level, click empty space below the bar chart.
For example, if the Settings menu has Source, Type, and Name selected, in that order, the first bar chart display has events grouped by Source. If you click the bar representing the events for one source, the display refreshes to show all the events for that source grouped by Type, which is the next grouping in the menu. If you then click the bar representing the events for one type, the display refreshes again, showing all the events for that source and type, grouped by name, and those bars are gray.
Each time the bar chart refreshes, the table of events refreshes accordingly.
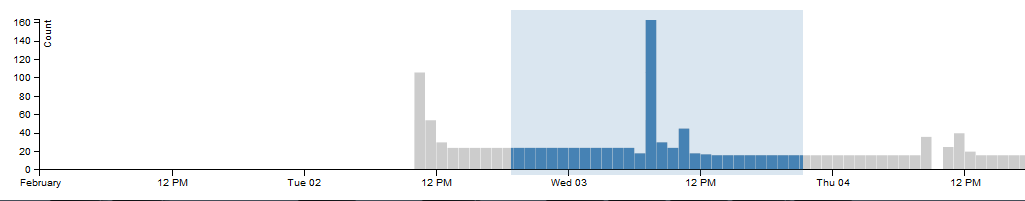
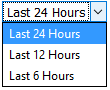
In the pane at the bottom of the view is a timeline that shows the number of events on the vertical axis and time on the horizontal axis. You can select the time span displayed by opening the drop-down menu in the upper right corner of the pane as shown in Figure 4.
You can also left-click and drag in the timeline to highlight a discrete period of time. The event table and bar chart panes refresh to display only the events included in the time frame you selected. Figure 5 shows a selected period of time in the timeline.